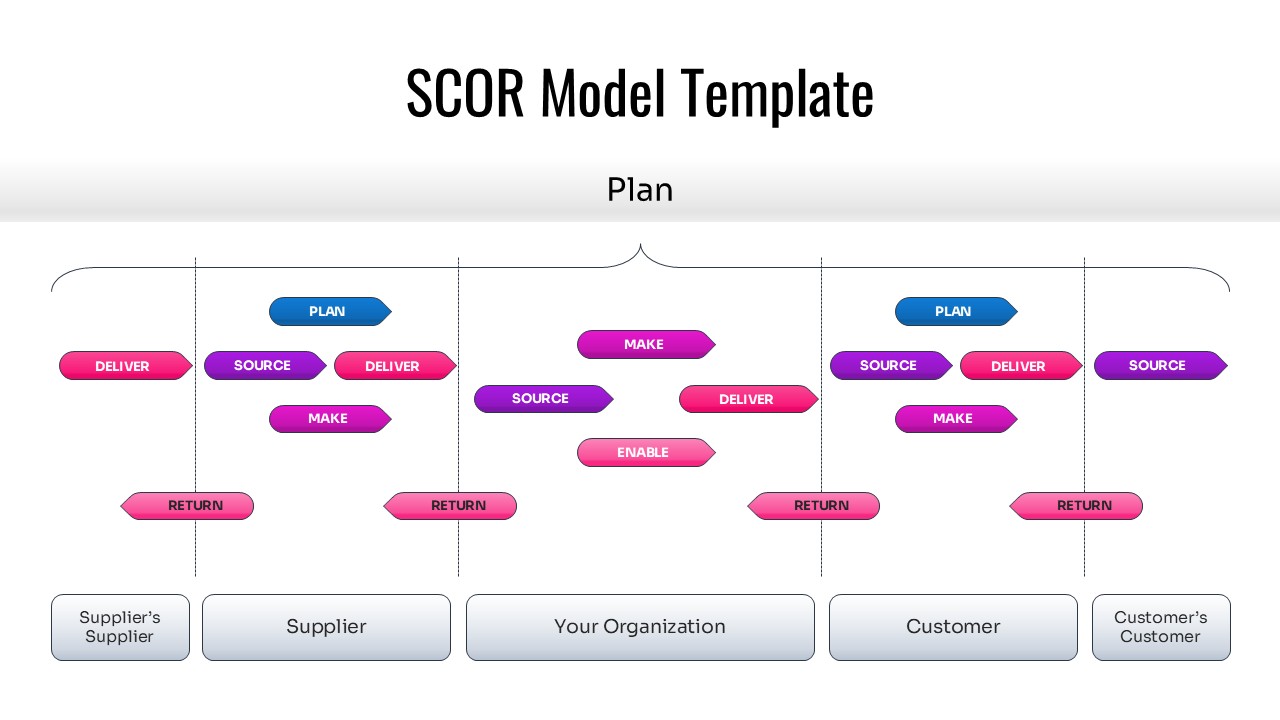
This slide provides a linear visualization of the SCOR Model, mapping out the relationships between suppliers, the organization, and customers. It uses color-coded nodes to distinguish between different process stages like ‘Enable’ and ‘Return’. The horizontal layout is perfect for explaining end-to-end supply chain connectivity.