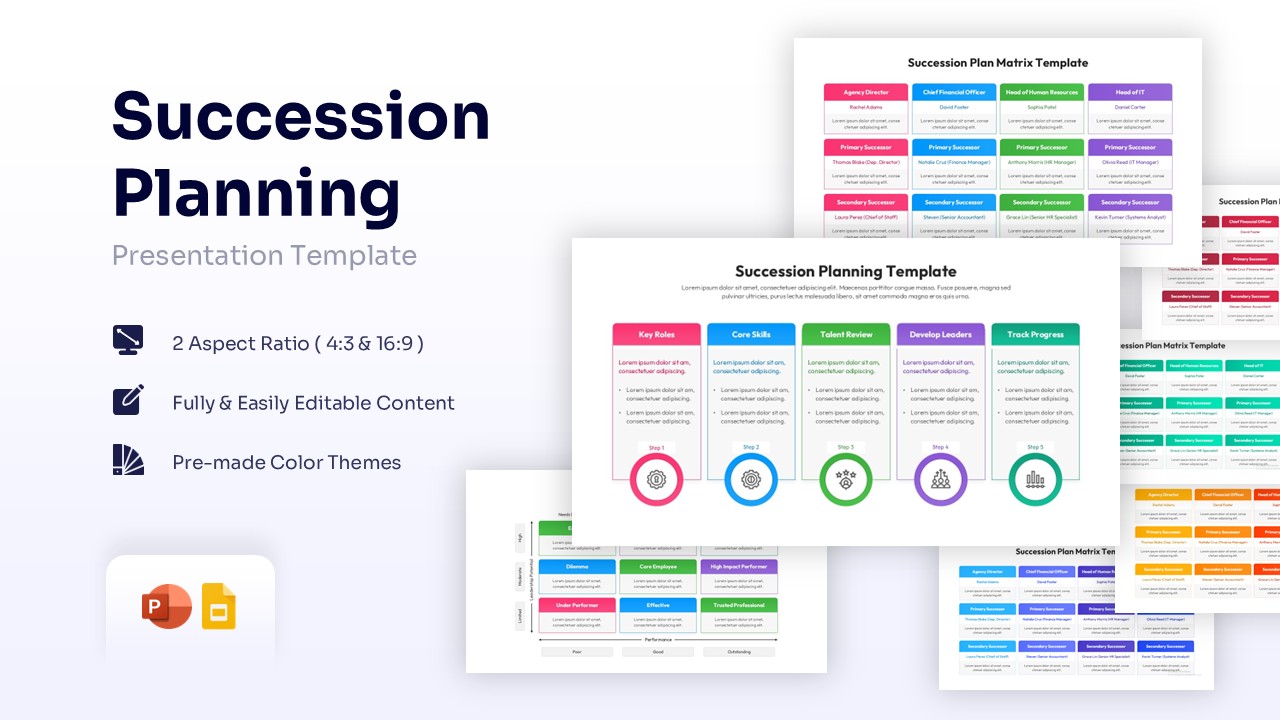
SIPOC Diagram Template for PowerPoint and Google Slides

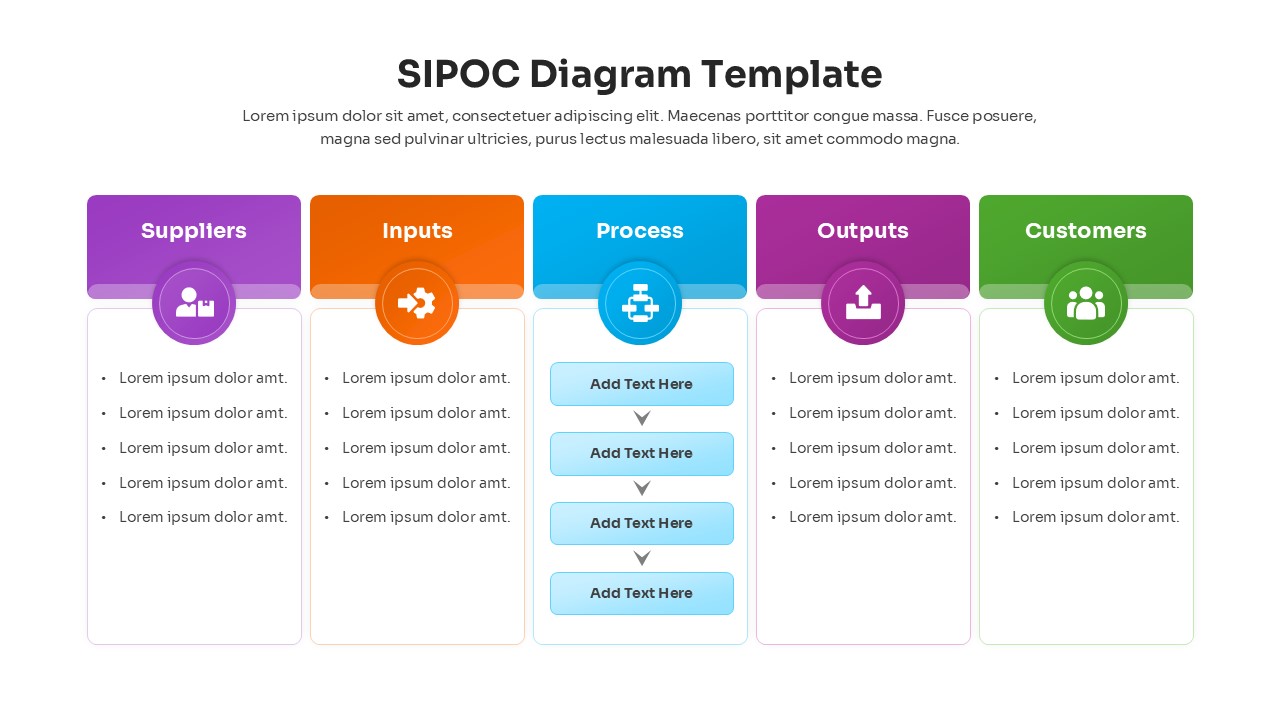

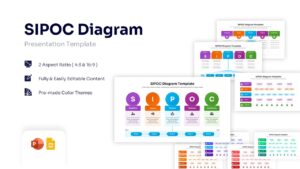
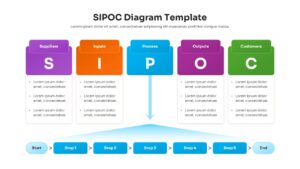
SIPOC Process Map Infographic Template
Download this SIPOC Diagram Template to map out your business processes with clarity and precision. The SIPOC framework—standing for Suppliers, Inputs, Process, Outputs, and Customers—is an essential tool for process improvement and Six Sigma initiatives. This presentation deck helps you define the scope of work at a high level, ensuring that everyone in the meeting understands the inputs required and the value delivered to customers before diving into granular details.
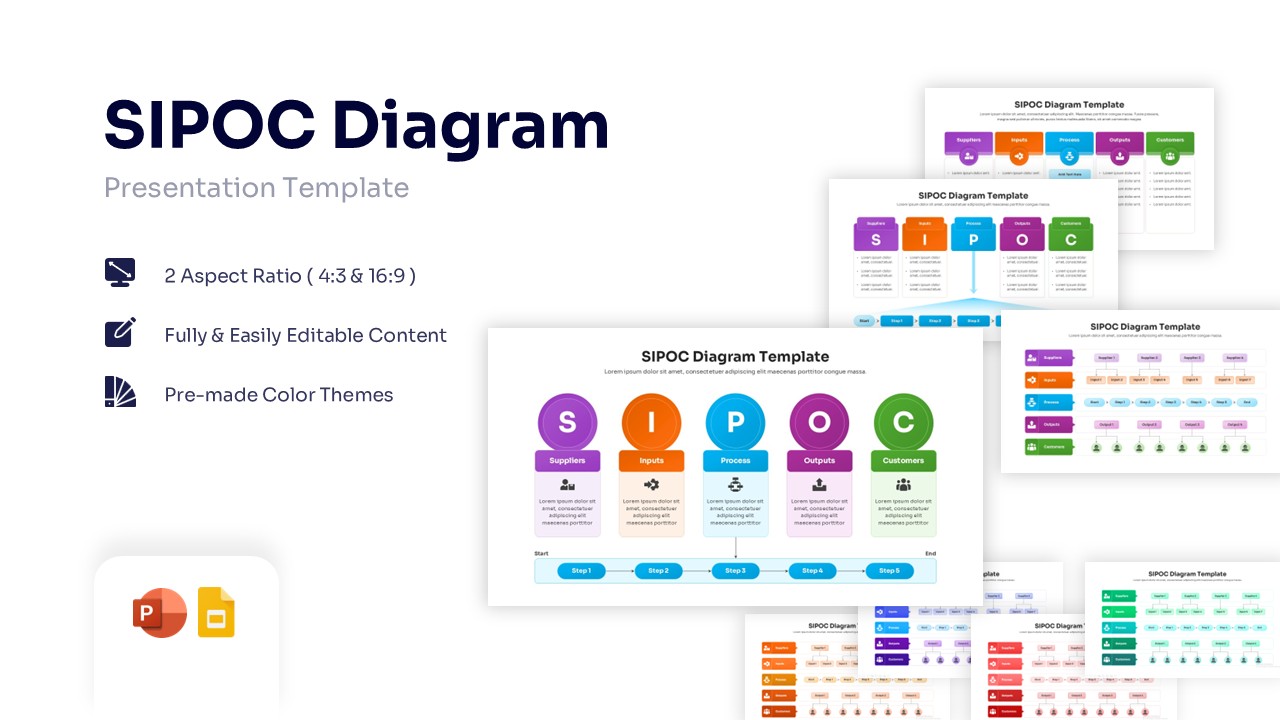
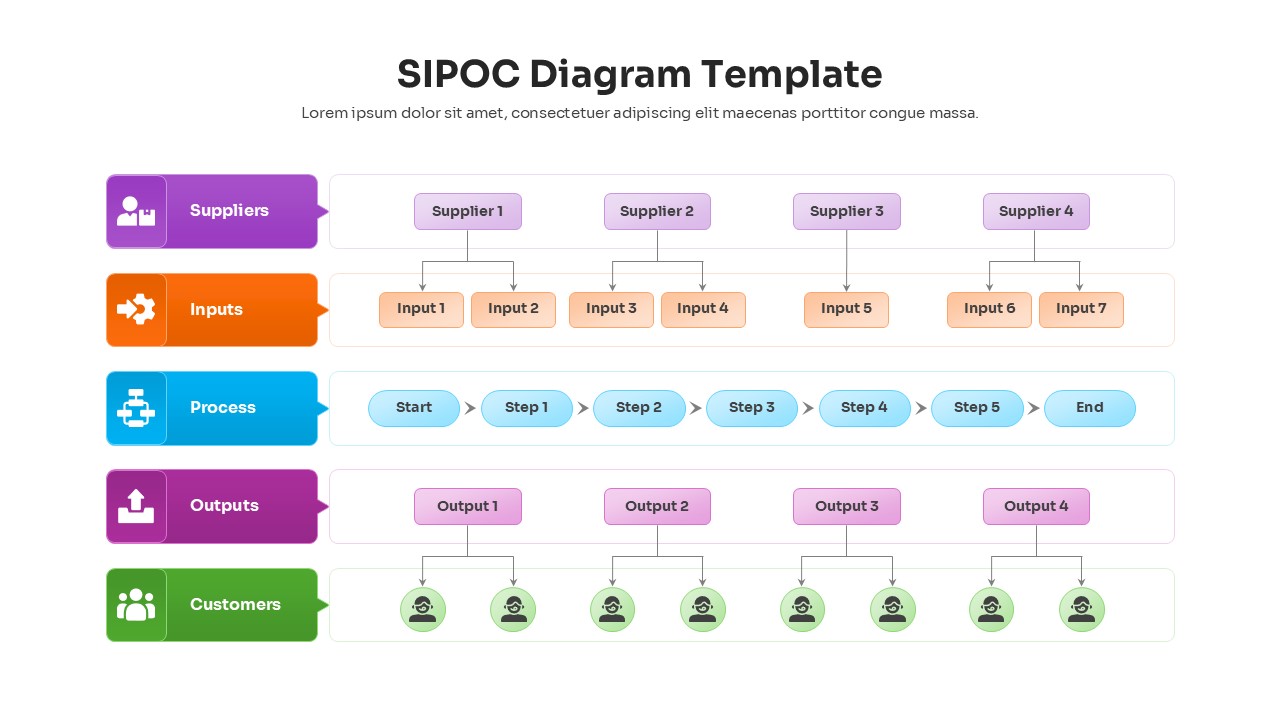
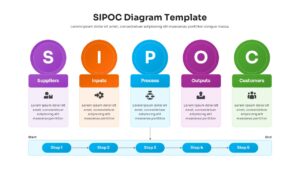
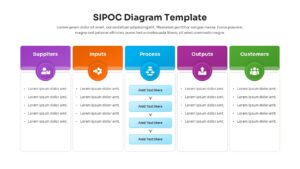
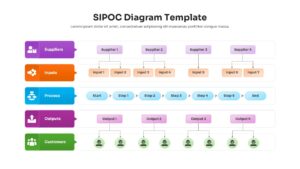
This SIPOC Infographic Template set includes multiple layout options, from linear flows and tabular views to circular diagrams, giving you the flexibility to present your data in the best format for your audience. These business strategy templates are fully editable, allowing you to adjust the text, change the color themes to match your brand, and resize the vector-based icons without losing quality. Whether you are conducting a DMAIC project or simply streamlining a workflow, these slides provide a structured and professional foundation.
You can use these SIPOC Diagrams in various scenarios, such as operational reviews, new employee onboarding, or stakeholder analysis meetings. They are particularly effective during the “Define” phase of a project, helping teams identify gaps in the process and clarify roles. By visualizing the connections between suppliers and customers, you can spot inefficiencies early and facilitate better decision-making across departments.
Why Use this SIPOC Process Infographics
- Provides a high-level overview of processes to align stakeholders quickly.
- Helps identify irrelevant inputs or non-value-added steps in a workflow.
- Saves time on design with pre-formatted, professional layouts.
- Simplifies complex process data into an easy-to-read visual format.
Who Should Download this SIPOC Infographics
Project Managers leading process improvement initiatives, Six Sigma Green/Black Belts, Business Analysts, Operations Managers, and Consultants defining project scopes.
Key Features
- Multiple layout variations
- 100% Vector-Based Graphics
- Fully Layered & Organized elements
- Pre-made Color Themes
- Includes both 4:3 and 16:9 aspect ratios
Frequently Asked Questions
- What is a SIPOC diagram used for?
- It is used to document a business process from beginning to end, helping teams identify all relevant elements—suppliers, inputs, process steps, outputs, and customers—before starting a project.
- Can I edit the column headers in this template?
- Yes, all text fields, including headers and descriptions, are fully editable in PowerPoint and Google Slides.
- Does this template support different color schemes?
- Absolutely. The template uses theme colors, so changing your presentation\'s color theme will automatically update the diagram\'s colors.
Related Templates
-
-
 $3.99
$3.99 -
 $2.99
$2.99 -