Value Chain Analysis Template for PowerPoint & Google Slides
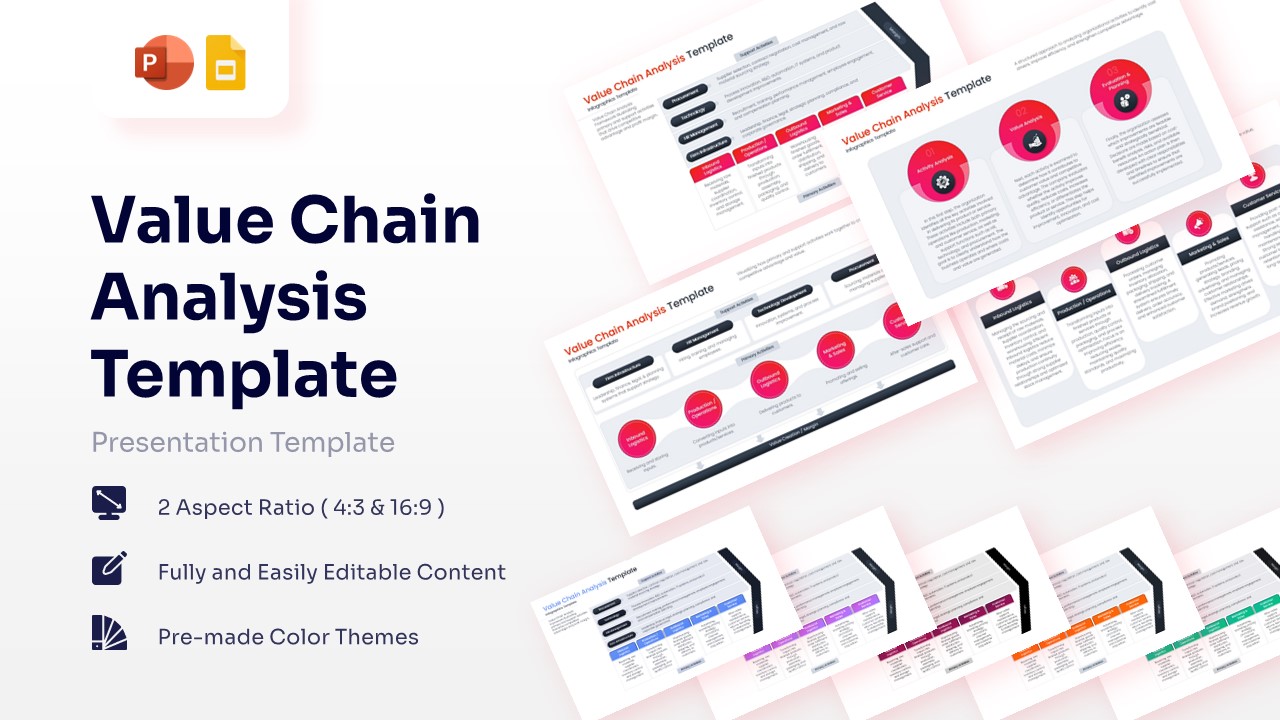
Strategic Value Chain Infographics Presentation Template
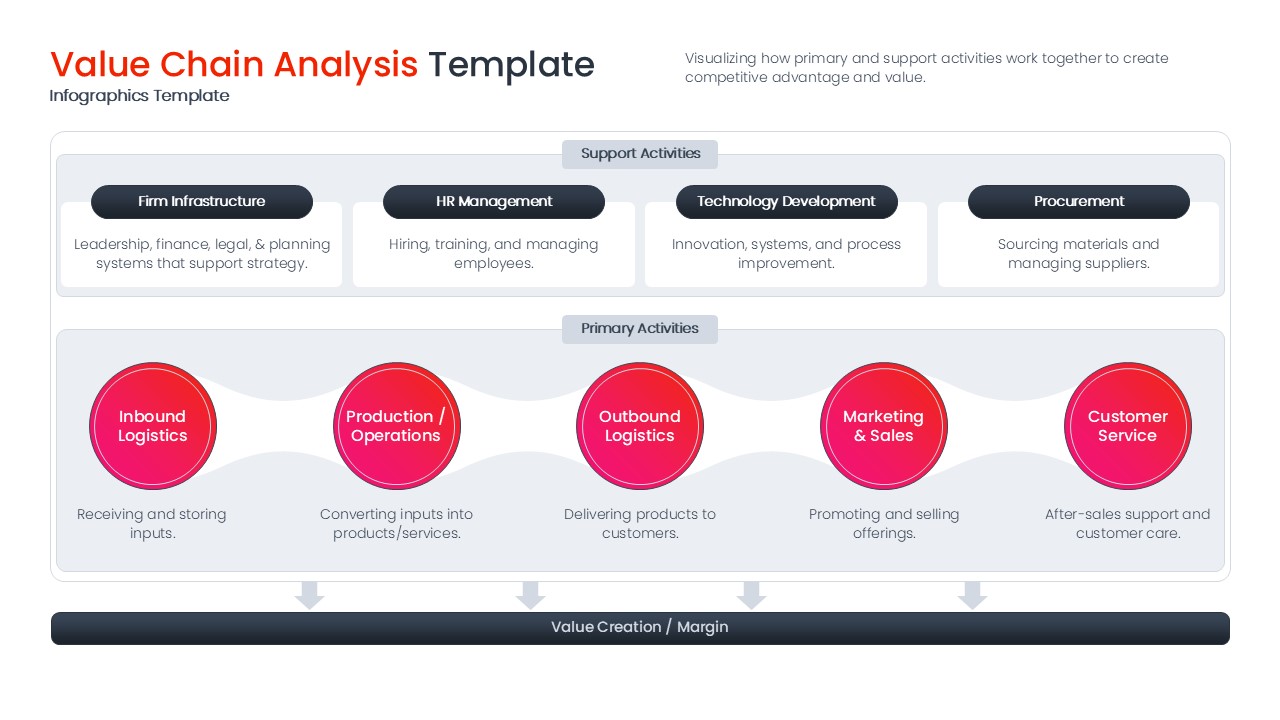
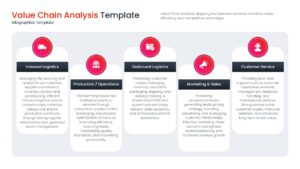
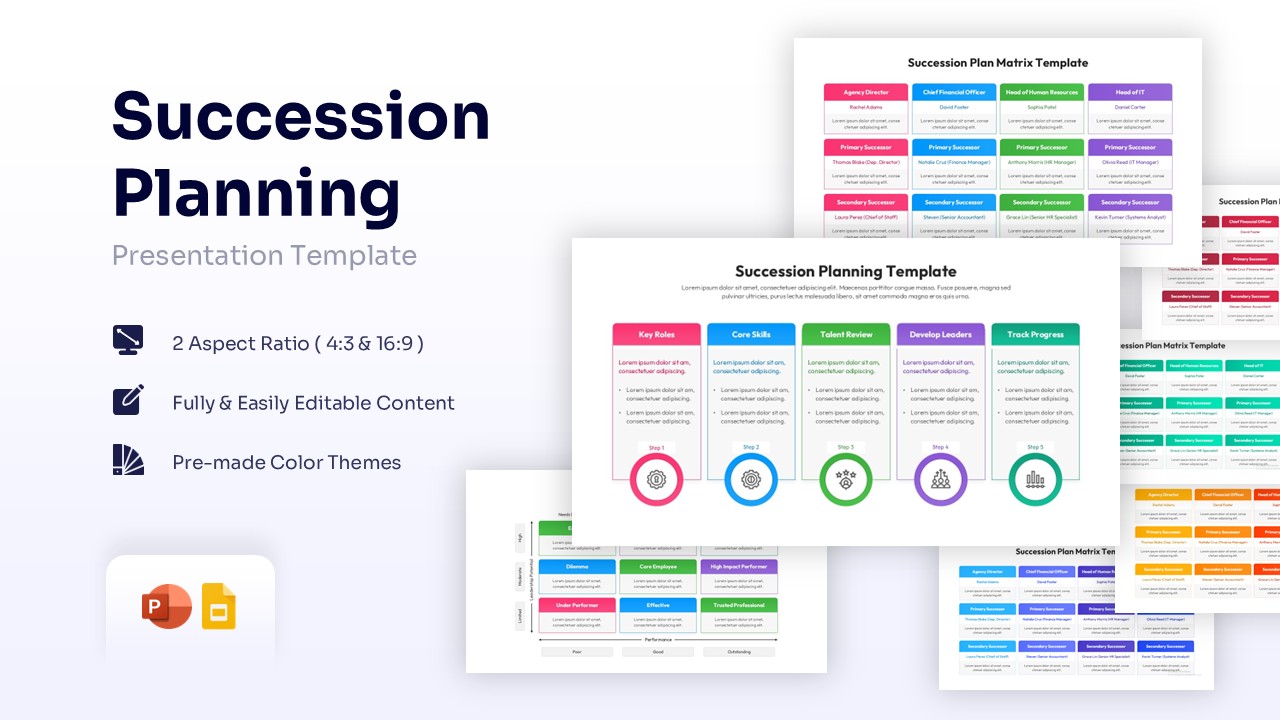
Download this Value Chain Analysis Template to break down your business operations and identify the specific activities that create value for your customers. Whether you are conducting a deep dive into internal logistics or auditing your after-sales support, these professional process flow infographic helps you visualize how each department contributes to your overall profit margin. Use it to present a clear picture of your competitive advantage during executive briefings, strategy workshops, or internal process reviews.
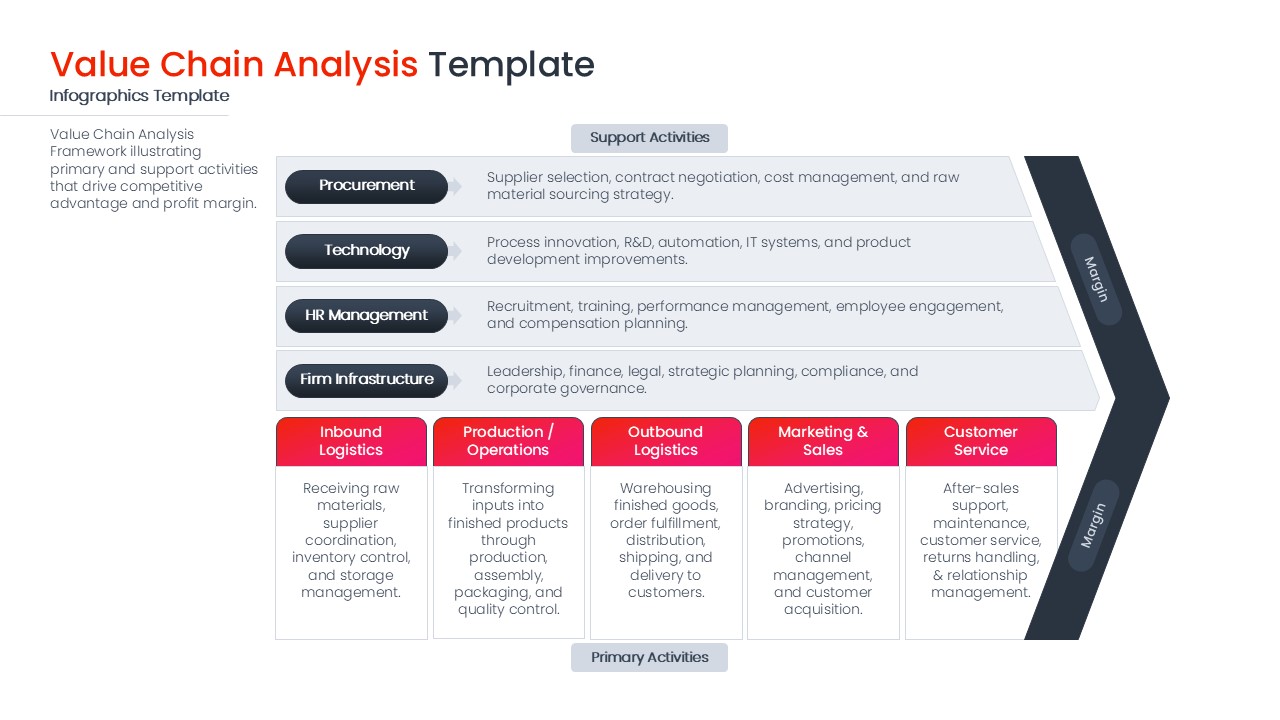
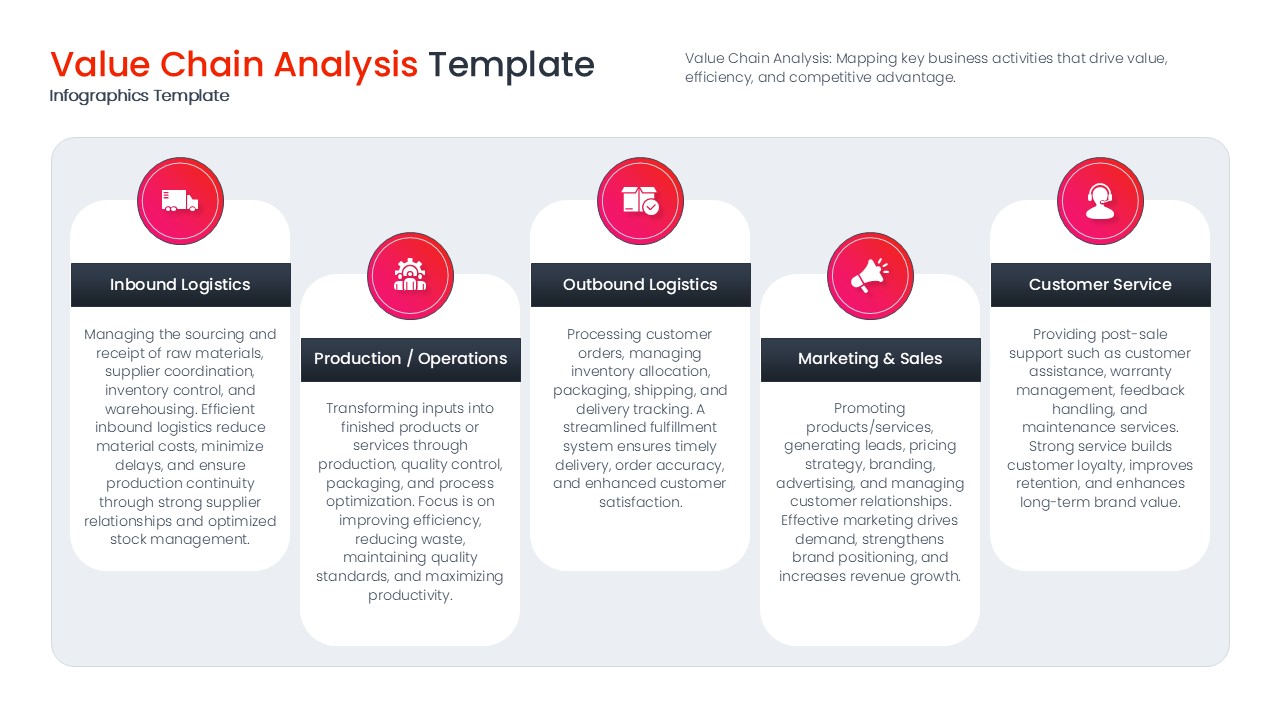
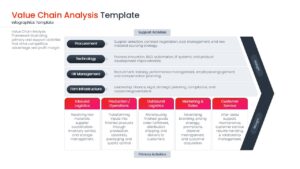
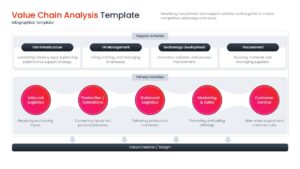
This professional set features the classic Porter’s Value Chain model, separating primary activities like production and marketing from support functions like HR and technology. The clean, horizontal layout and modern chevron shapes make it easy for your audience to follow the flow of value creation from raw materials to the final consumer. With dedicated sections for inbound logistics, operations, and service, you can pinpoint exactly where to reduce costs or improve efficiency.
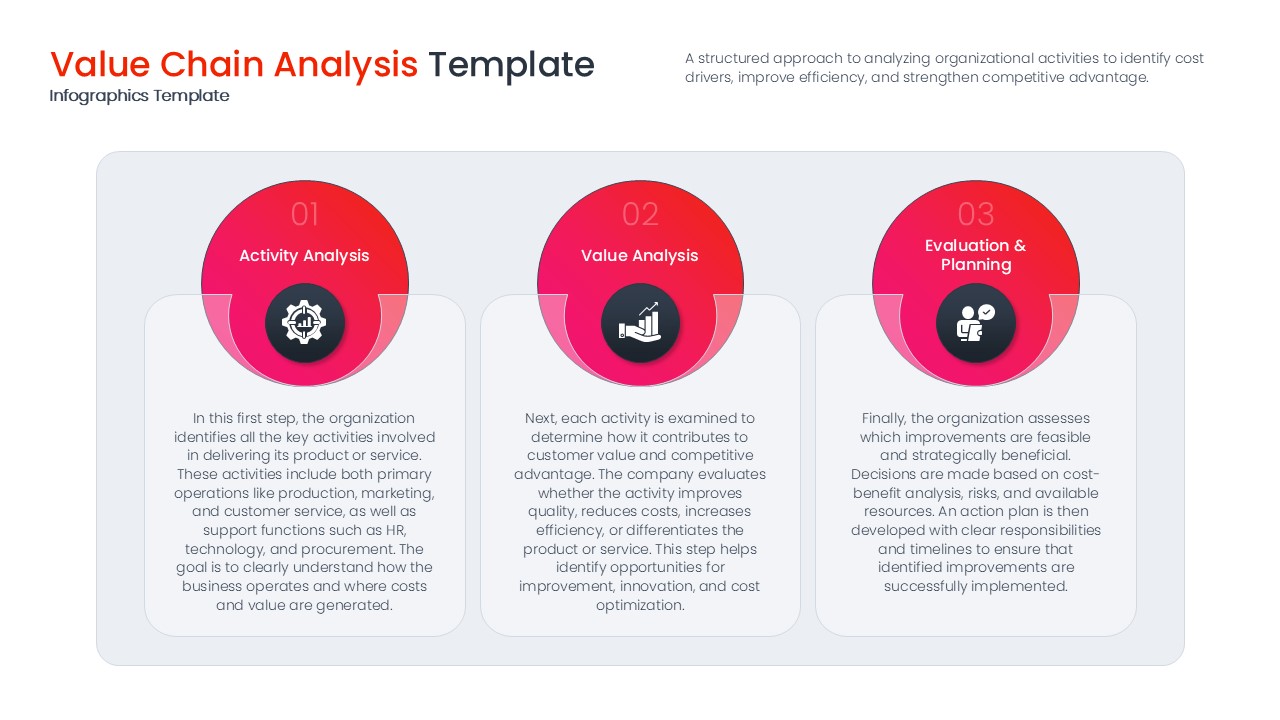
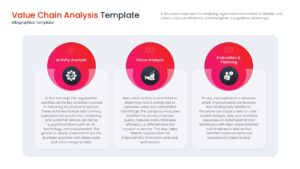
These Value Chain Analysis Diagrams are perfect for documenting a company’s strategic roadmap or performing a comprehensive SWOT-aligned internal audit. The versatile design allows you to zoom in on specific steps—such as activity analysis or value evaluation—ensuring your team stays aligned on project goals. Because the graphics are fully editable, you can quickly adjust the color themes to match your corporate branding, saving you hours of manual formatting.
Why Use this Value Chain Analysis Template
- Identifies Cost Drivers: Helps management visualize where resources are being spent across the supply chain.
- Enhances Competitive Advantage: Pinpoints unique strengths in your production or service model.
- Simplifies Complex Data: Turns intricate organizational structures into easy-to-read infographics.
- Professional Consistency: Ensures a polished look for high-stakes stakeholder meetings and investor pitches.
Who Should Download this Value Chain Analysis Diagram
- Strategic Planners: To map out organizational efficiency and long-term growth strategies.
- Operations Managers: For analyzing production workflows and logistics bottlenecks.
- Business Consultants: To deliver clear, actionable insights to clients regarding their value proposition.
- Marketing & Sales Teams: To understand how their efforts integrate with the broader company value stream.
Key Features
- 100% Vector-Based Graphics
- Fully Layered & Organized
- Multi-Platform Support
- Theme Color & Theme Font
- Easily Editable Icons and Text Placeholders
Frequently Asked Questions
- Can I change the icons in this value chain model?
- Yes, all icons are vector-based and can be swapped or resized without losing quality to fit your specific industry needs.
- Is the \"Margin\" section adjustable?
- Absolutely. The chevron representing the profit margin is fully editable, allowing you to resize it or change its color to reflect your financial data.
- Does this work on Mac and PC?
- Yes, the template is fully compatible with PowerPoint on both Windows and Mac, as well as Google Slides through any web browser.
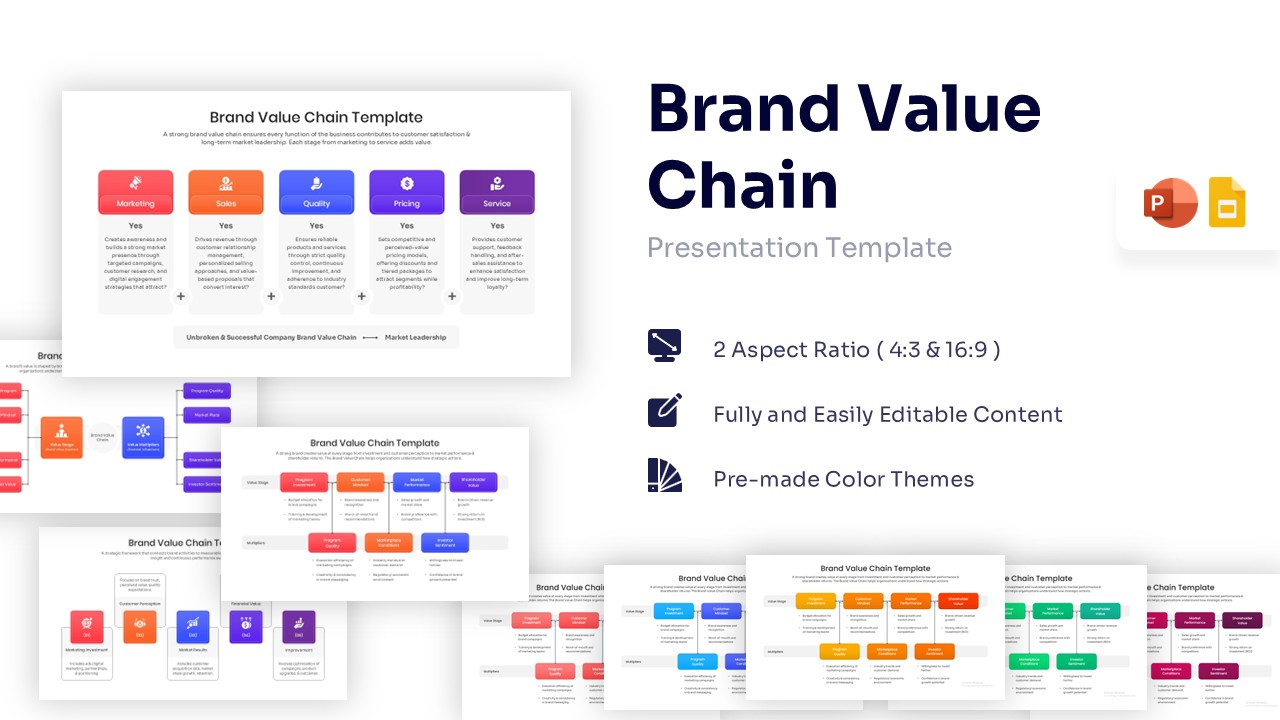
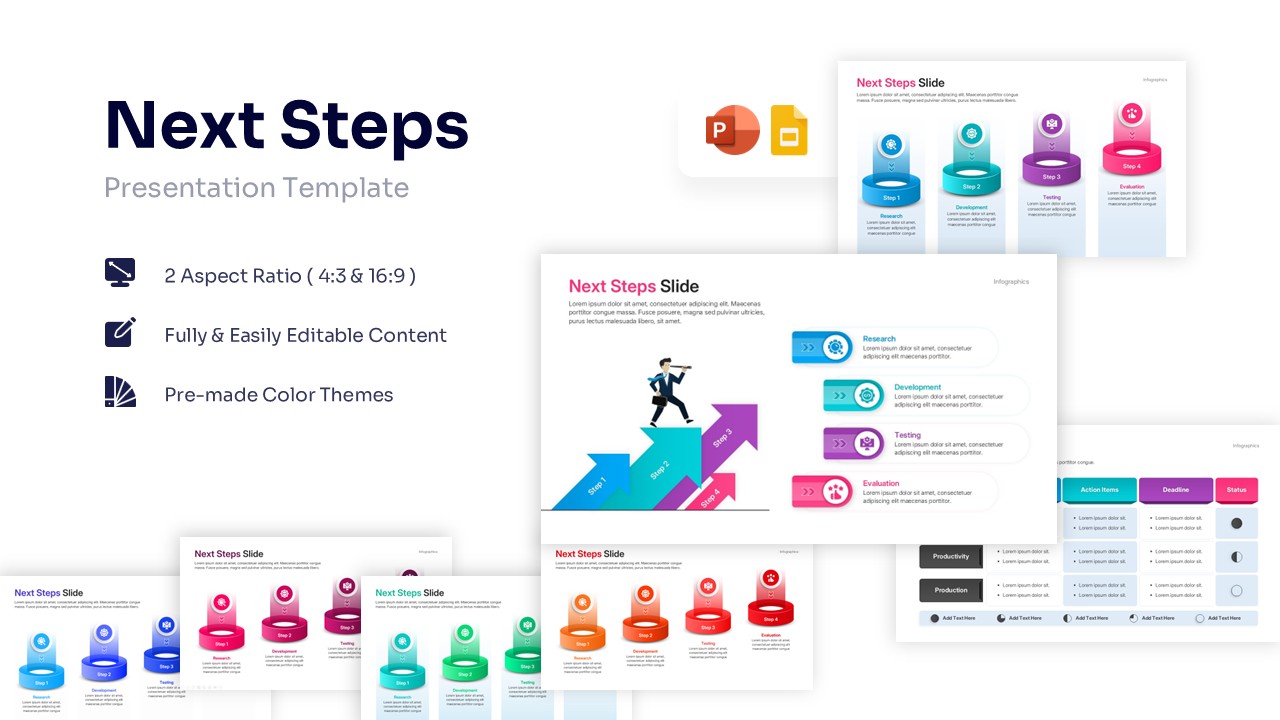
Related Templates
-
 $3.99
$3.99 -
-
-
 $3.99
$3.99