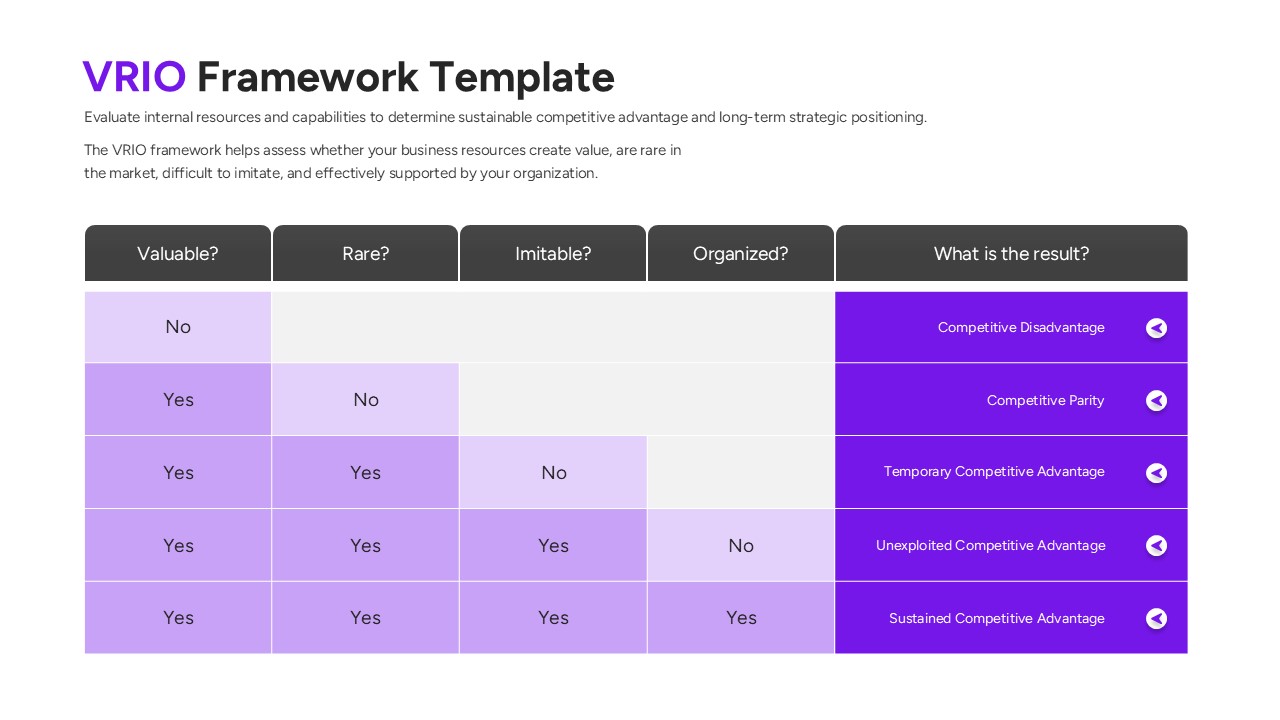
This final slide maps out the different outcomes of a VRIO audit based on various “Yes/No” combinations. It clearly identifies whether a resource leads to a competitive disadvantage, parity, or a sustained advantage. The tiered color coding helps in distinguishing between different levels of market positioning.