Break Even Analysis Template for PowerPoint & Google Slides


Financial Break-even Slides for Business Strategy
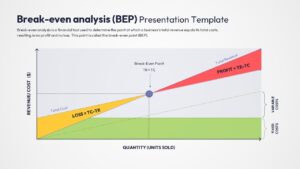
Download this Break Even Analysis Template and use case for determining the exact output level where your business transitions from loss to profitability. To better understand your overall corporate health, you can pair these slides with our comprehensive financial summary reports to give stakeholders a full view of your fiscal standing. This slide deck simplifies complex accounting data into a clean, visual format that anyone from a junior analyst to a C-suite executive can grasp instantly.
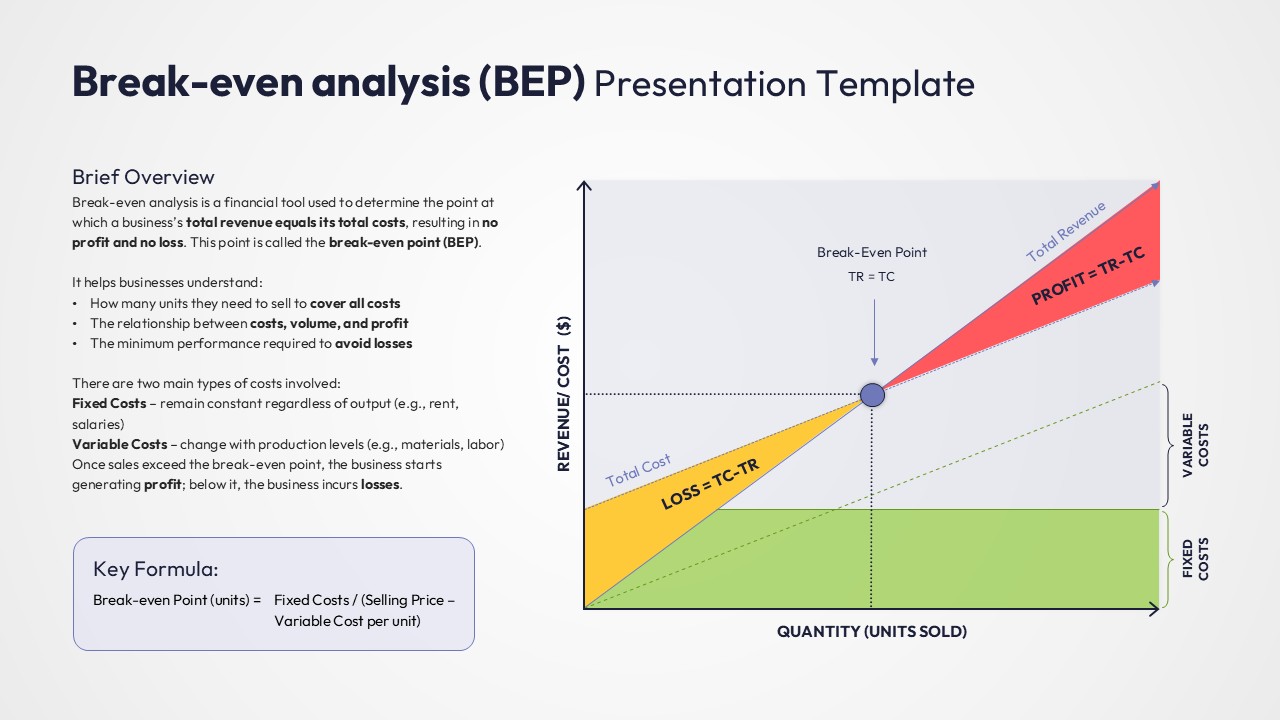
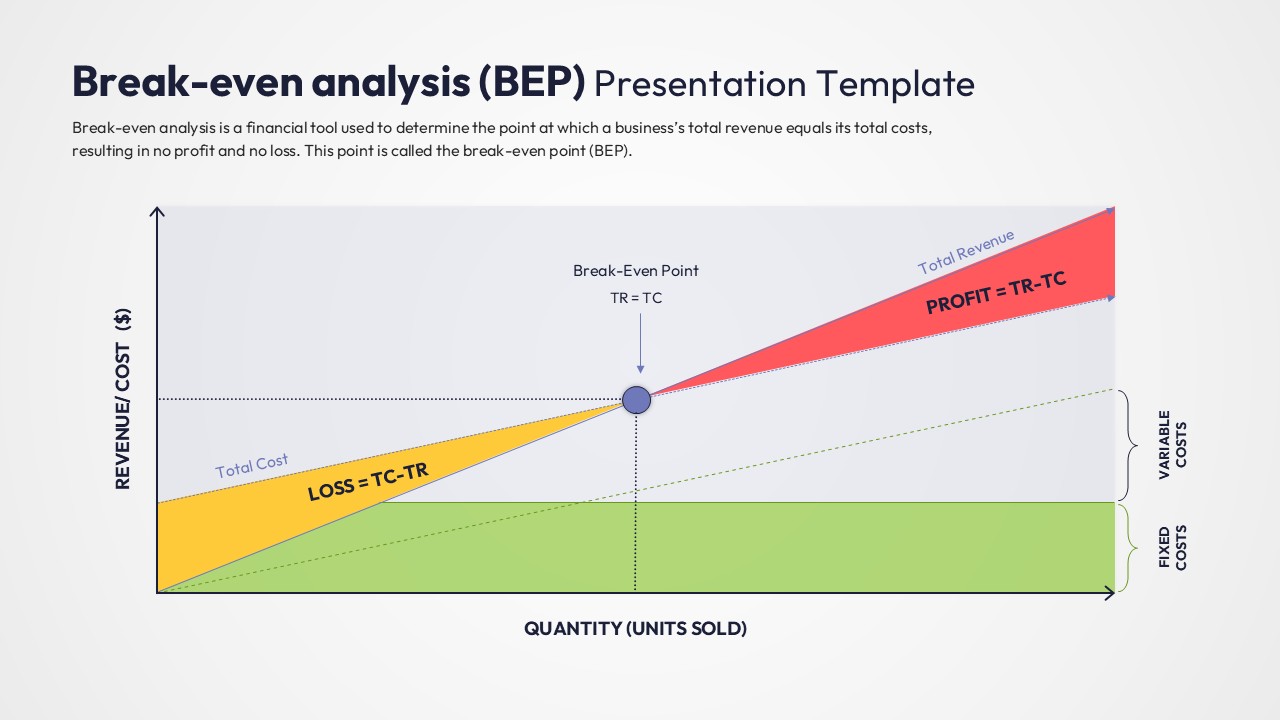
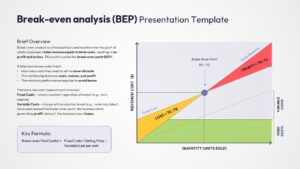
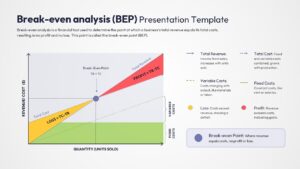
This Break-Even Analysis (BEP) Presentation Template layout provides a professional framework to showcase fixed costs, variable costs, and total revenue intersections. By utilizing this profit and loss visualization, you can clearly demonstrate the “Margin of Safety” and the specific unit sales required to cover all operational expenses. These infographic slides are essential for quarterly business reviews, startup pitch decks, and internal budget planning sessions where data accuracy and visual clarity are paramount.
Every element in this visual framework is a high-quality vector, allowing you to scale the graphics without any pixelation or loss of detail. You can easily integrate these elements into your broader strategic business plan presentation to ensure your growth projections are grounded in solid break-even logic. The slide deck is designed with a user-friendly interface, making it simple to swap colors, adjust text, and modify data points to reflect your unique product pricing and cost structures.
Why Use these Financial Break Even Slides – Cost-Volume-Profit Analysis
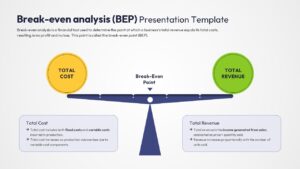
- Provides a crystal-clear visual of the intersection between total cost and total revenue.
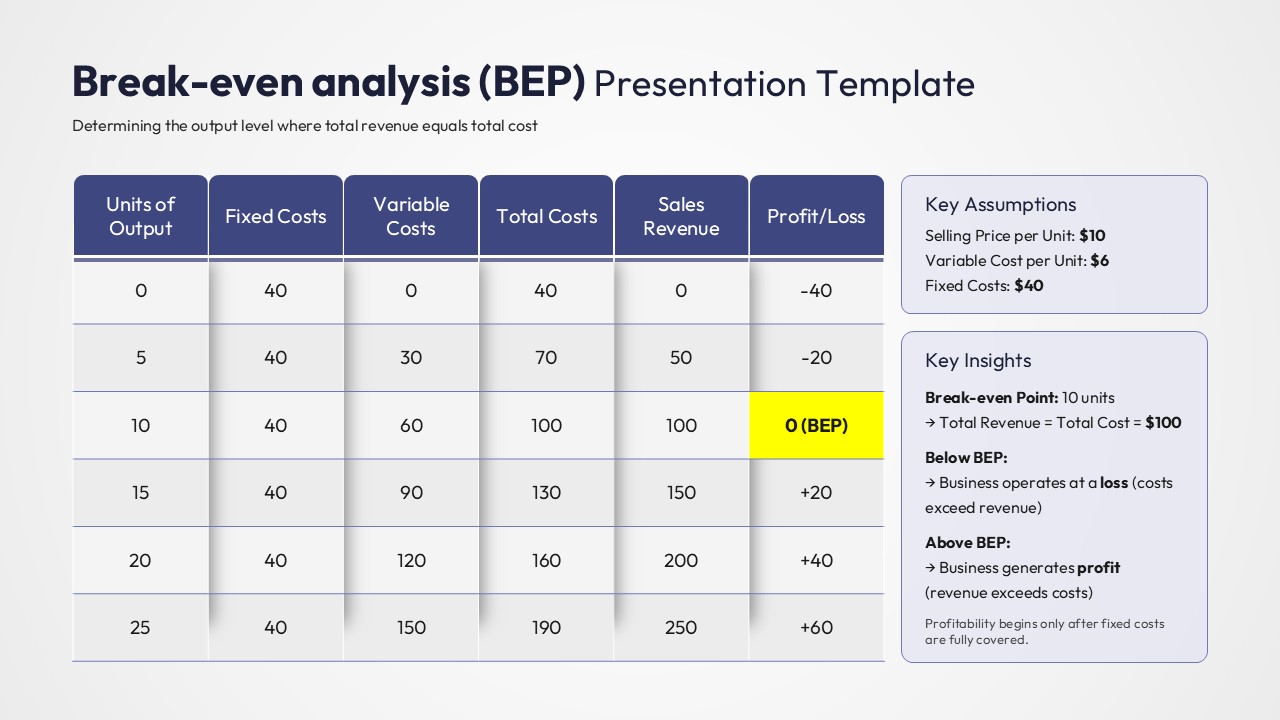
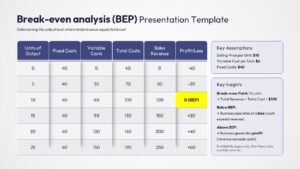
- Reduces complex accounting formulas into easy-to-read charts and data tables.
- Saves hours of design time with pre-formatted axes and legend callouts.
- Ensures consistent branding with fully editable theme colors and professional fonts.
Who Should Download this Break-Even Analysis Template – Financial Strategy
- Financial Analysts and Accountants looking to present monthly performance data.
- Startup Founders needing to show investors when the company will become profitable.
- Business Students and Educators teaching the fundamentals of cost accounting.
- Project Managers evaluating the feasibility of new product launches or service lines.
Key Features
- 100% Vector-Based Graphics
- Fully Layered & Organized
- Multi-Platform Support
- Theme Color & Theme Font
- Interactive Break-even Chart Logic
- Detailed Cost-Benefit Data Tables
Frequently Asked Questions
- How do I adjust the break-even point in this profit and loss visualization?
- Since the graphics are vector-based, you can simply click and drag the intersection point and the revenue/cost lines to align with your specific data calculations.
- Is the data table in this BEP presentation layout Excel-linked?
- The table is built natively in PowerPoint/Google Slides for easy manual entry, but you can copy and paste data directly from Excel while maintaining the professional formatting.
- Can I change the colors of the Profit and Loss zones?
- Yes, the green \"Profit\" and yellow \"Loss\" areas are separate shapes that can be recolored using the \"Shape Fill\" tool to match your specific corporate brand guidelines.
Related Templates
-
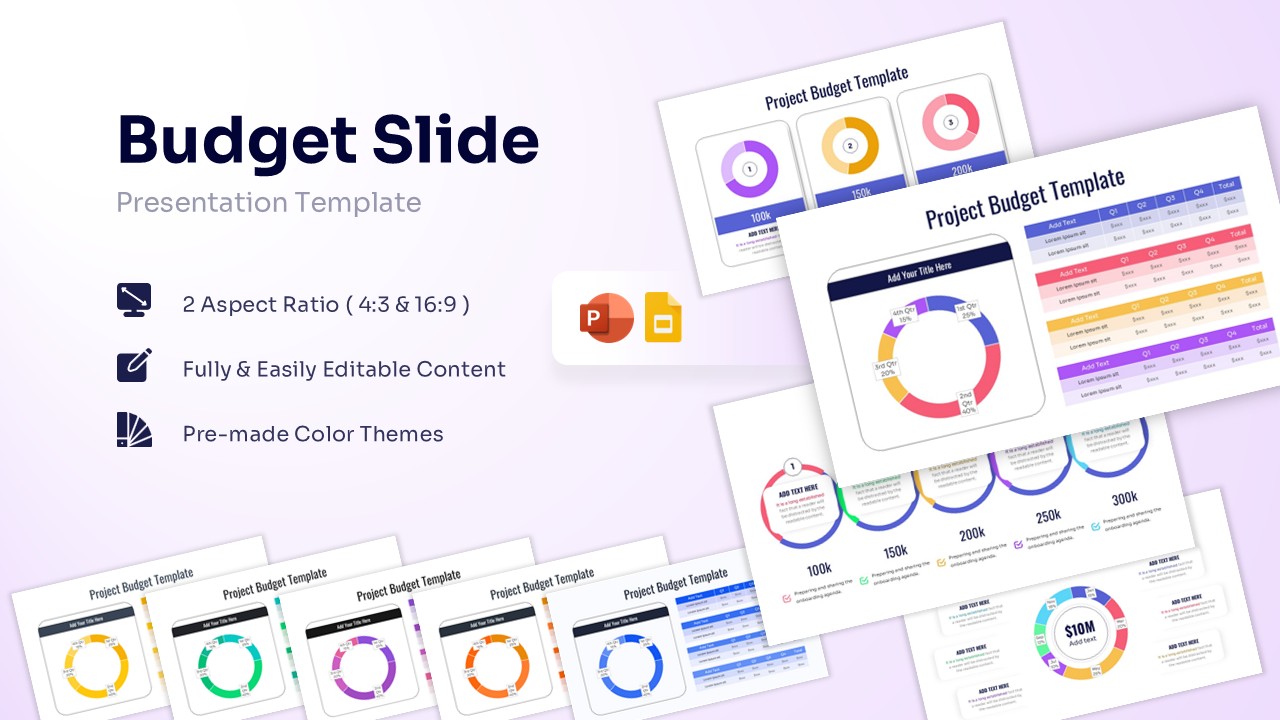
Project Budget Template for PowerPoint & Google Slides
Annual Report
$3.99 -
 $4.99
$4.99 -
 $2.99
$2.99 -
 $3.99
$3.99