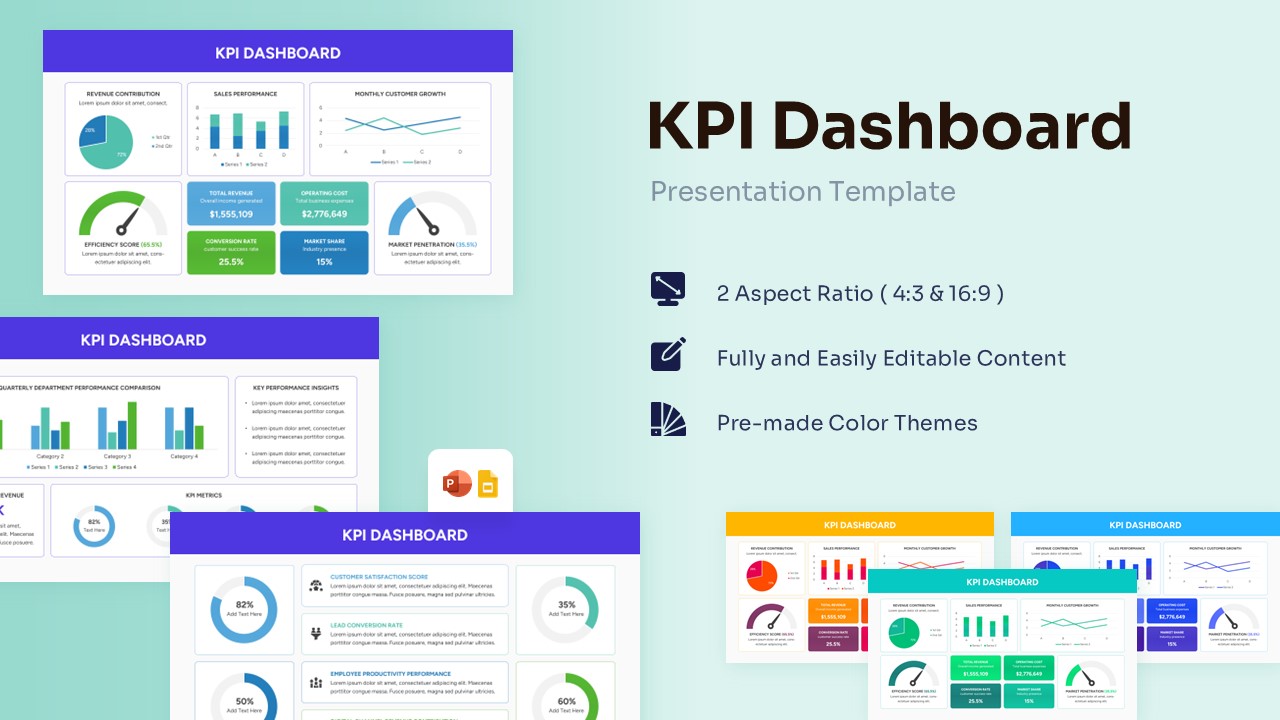
OKR Dashboard Template for PowerPoint & Google Slides
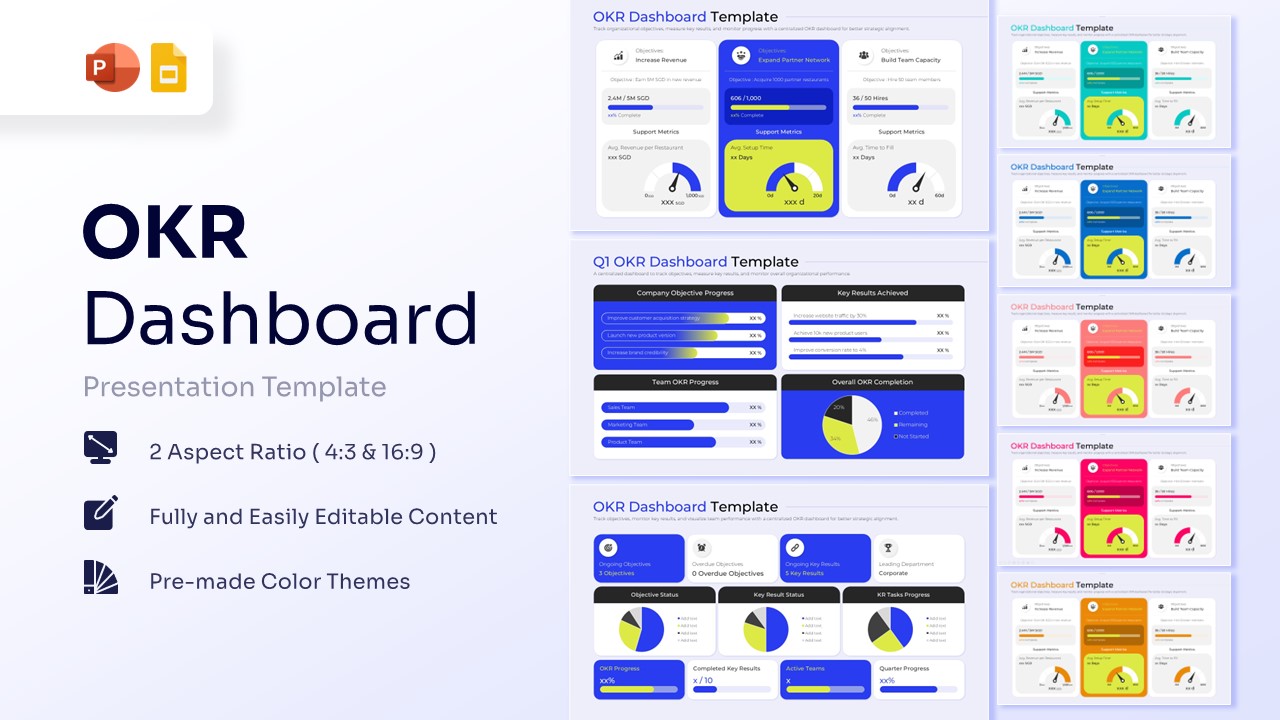


OKR Presentation Template
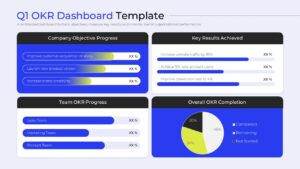
Download this OKR Dashboard Template and use this for quarterly business reviews, team alignment workshops, or executive performance reporting. Efficiently managing your company’s targets is easier when you utilize a professional data visualization dashboard to communicate complex metrics. This OKR Dasboard ensures every stakeholder understands the connection between daily tasks and long-term vision.
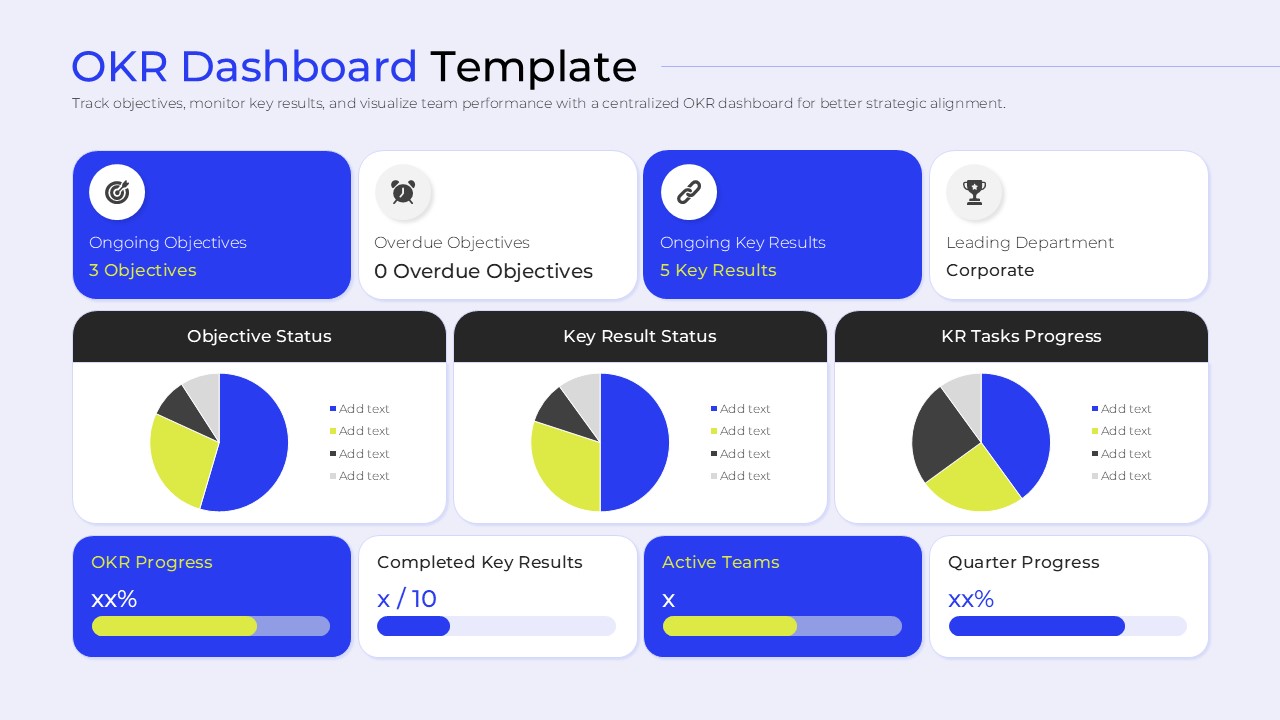
Monitoring organizational health becomes intuitive with this strategic performance dashboard. These infographic diagram provide a centralized view of your “Objectives and Key Results,” allowing managers to pinpoint bottlenecks before they impact the bottom line. By using this business goal visualization, you can move away from messy spreadsheets and present a polished, data-driven narrative to your leadership team.
Why Use these OKR Progress Tracker – Strategic Performance Dashboard
- Provides a high-level overview of company goals to improve team transparency and focus.
- Reduces reporting overhead by using pre-formatted layouts for KPIs and status updates.
- Ensures a professional aesthetic with consistent design elements across all performance slides.
- Allows for rapid updates during live meetings to reflect real-time progress and metric shifts.
Who Should Download this OKR Dashboard – Business Goal Visualization
- Project Managers and Team Leads responsible for tracking quarterly performance targets.
- Startup Founders and Executives needing to present growth metrics to investors.
- Operations Managers looking for a centralized way to monitor departmental efficiency.
- HR Professionals facilitating goal-setting workshops and performance management cycles.
Key Features
- 100% Vector-Based Graphics
- Fully Layered & Organized
- Multi-Platform Support
- Theme Color & Theme Font
- Interactive Speedometer Gauges
- Pre-designed Progress Bars
Frequently Asked Questions
- Can I customize the gauges in this OKR progress tracker?
- Yes, all speedometer gauges and progress bars are fully editable vector shapes, allowing you to manually adjust the needle positions and fill levels to match your specific data points.
- Is this objective and key results slide compatible with Google Slides?
- Absolutely. This product is designed for cross-platform compatibility, ensuring all charts, icons, and layouts function perfectly in both Microsoft PowerPoint and Google Slides.
- Does the slide deck include different color themes?
- The package comes with several pre-made color variations, but you can also use the \"Design\" tab in PowerPoint to apply your own custom color palette to the entire dashboard instantly.
Related Templates
-
 $3.99
$3.99 -
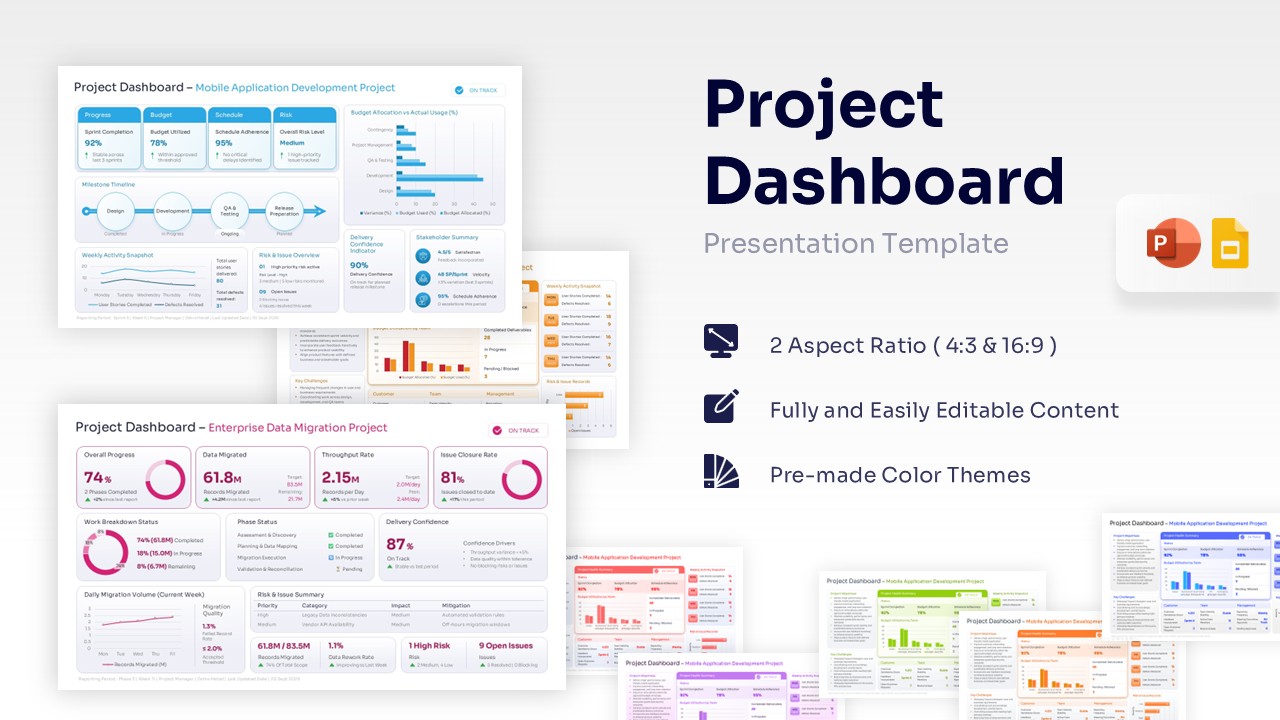
Project Dashboard Template for PowerPoint & Google Slides
Charts & Graphs
$3.99 -
 $3.99
$3.99 -