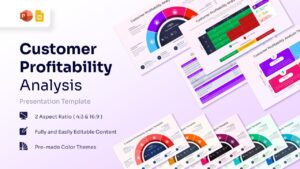
Customer Profitability Analysis Template for PowerPoint & Google Slides


Customer Segmentation Dashboard Presentation Template
Download this Customer Profitability Analysis Template and use case for identifying high-value segments and weeding out resource-draining accounts. To strengthen your broader business planning, you can explore our strategic business plan presentation slides to align financial goals with operational tasks. This presentation infographic provides a clear breakdown of acquisition costs and retention rates to drive smarter decision-making.
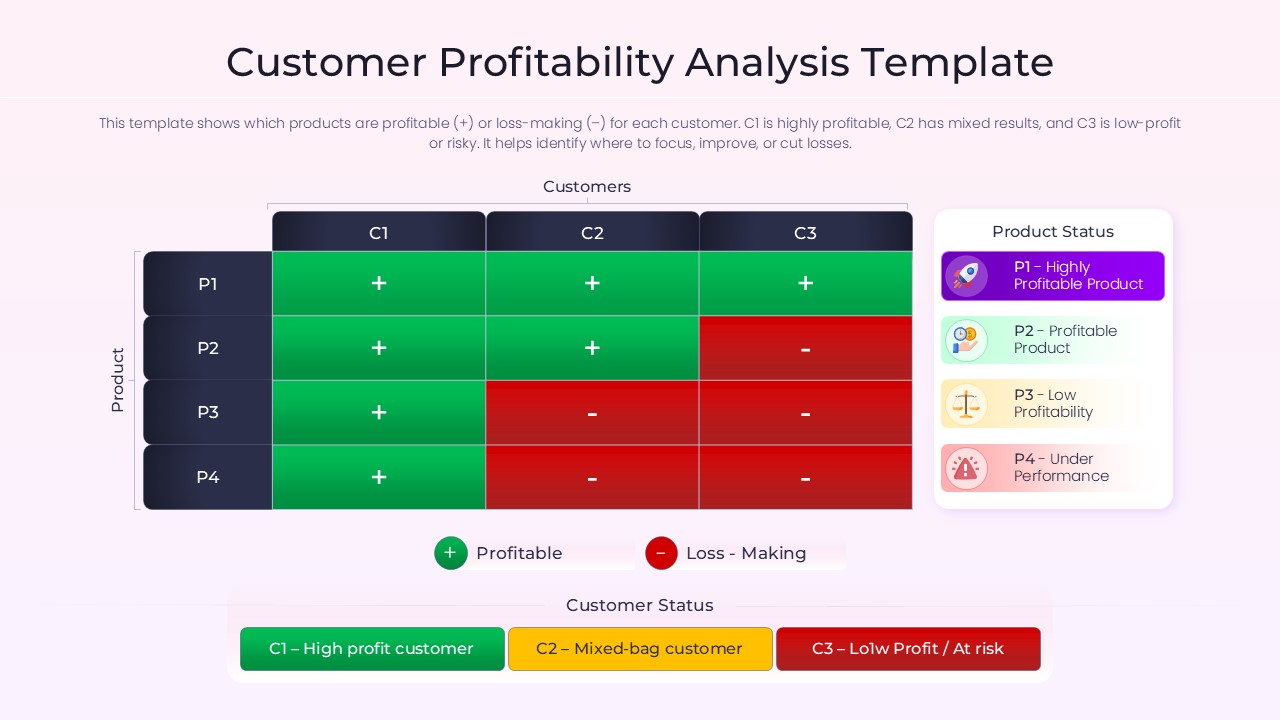
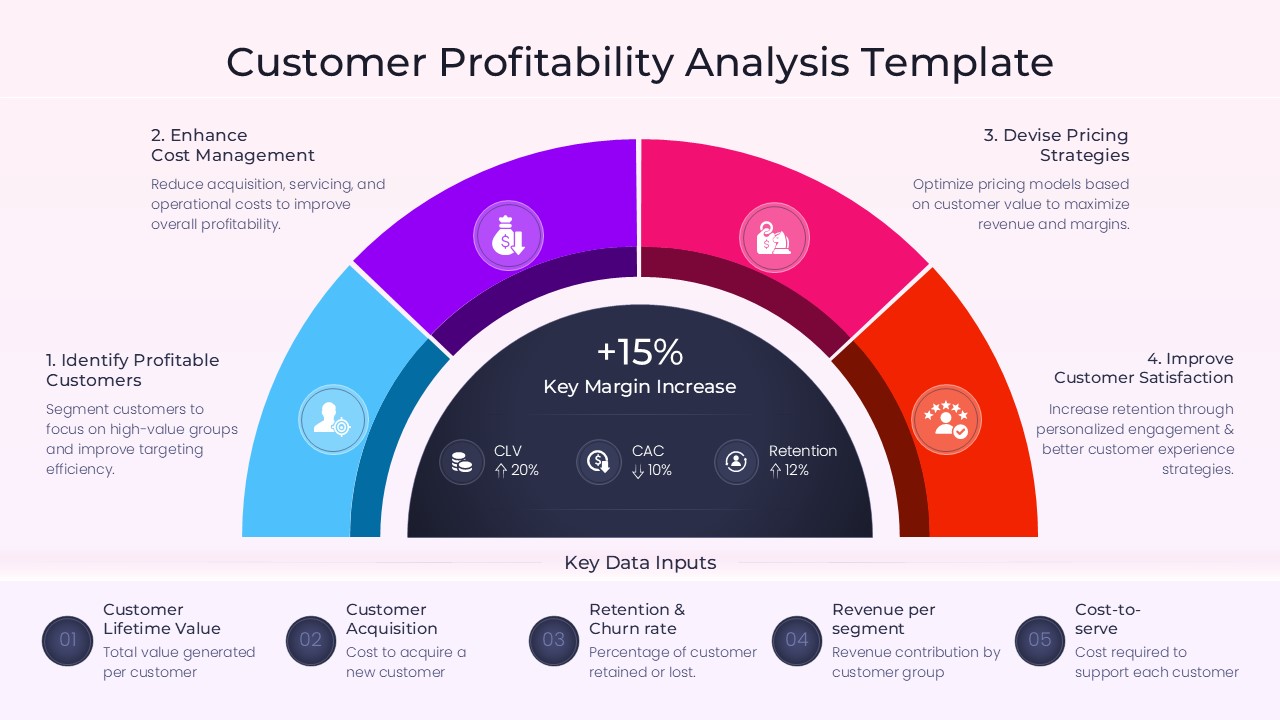
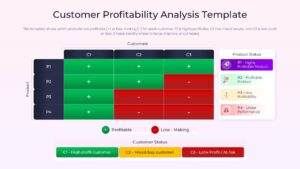
This Profitability Matrix Slide allows managers to categorize clients based on their strategic importance and financial contribution. These infographic slides visualize complex data through semi-circular gauges, heat maps, and comparison tables, making it easier to present to stakeholders. By moving beyond basic spreadsheets, these presentation layouts help you communicate the “why” behind your sales strategy and resource allocation.
Every element is a vector graphic, ensuring this visual framework remains crisp and professional even when scaled for large boardroom projectors. You can effortlessly adjust colors and fonts to match your brand, or integrate these slides into a larger financial report and annual review deck for a comprehensive executive briefing. The user-friendly design ensures that even those without graphic design skills can produce high-quality financial visualizations in minutes.
Why Use this Customer Profitability Analysis Template
- Provides a clear visual representation of client ROI to improve strategic resource allocation.
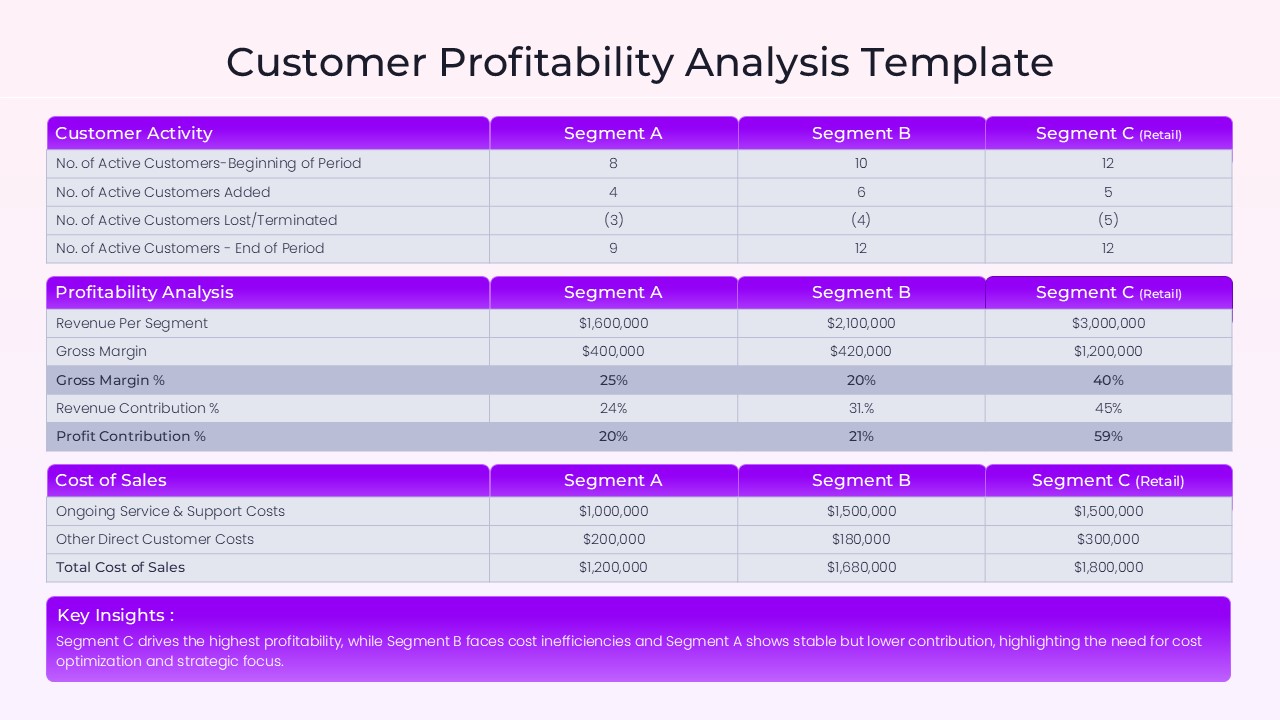
- Reduces prep time by using pre-designed tables for gross margin and revenue contribution analysis.
- Ensures a professional look with a consistent design language across all financial data points.
- Allows for high levels of customization to highlight specific customer groups or underperforming products.
Who Should Download this Profitability Analysis Template – Customer Segmentation Dashboard
- Financial analysts and controllers needing to report on departmental or client-based margins.
- Sales managers and account executives looking to prioritize high-potential leads and retain key accounts.
- Startup founders and entrepreneurs preparing pitch decks to demonstrate unit economics and scalability.
- Marketing agencies aiming to prove the effectiveness of customer acquisition campaigns.
Key Features
- 100% Vector-Based Graphics
- Fully Layered & Organized
- Multi-Platform Support
- Theme Color & Theme Font
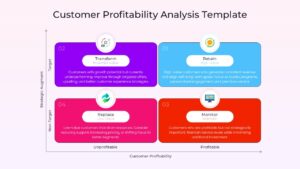
- Editable Customer Profitability Matrix (Target vs. Profitability)
- Pre-populated Data Tables for Gross Margin Analysis
Frequently Asked Questions
- How do I edit the data in the Customer Profitability Analysis tables?
- The tables are fully editable shapes; simply click into the cells to change the numbers and labels to reflect your specific business data.
- Can I change the colors of the Profitability Matrix Slide segments?
- Yes, every section of the matrix and gauge is a vector shape that can be recolored using the standard fill tool in your presentation software.
- Is this Client Lifetime Value Model compatible with Google Slides?
- Absolutely, the file is fully optimized for both PowerPoint and Google Slides to ensure seamless cross-platform functionality.
Related Templates
-
 $4.99
$4.99 -
-
 $3.99
$3.99 -
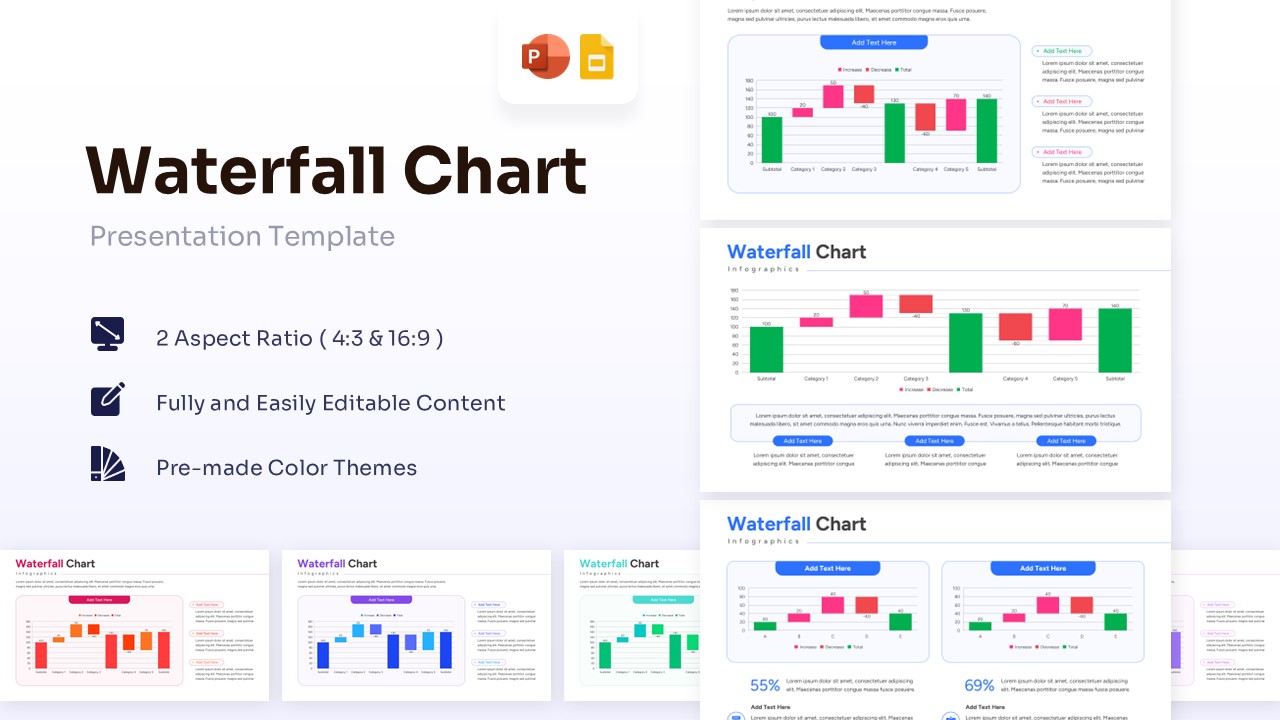
Waterfall Chart Template for PowerPoint & Google Slides
Bar and Column
$3.99