Your Cart
0 Assets added
Your cart is empty.
Home Safety Pyramid Template for PowerPoint & Google Slides Incident Triangle Infographics
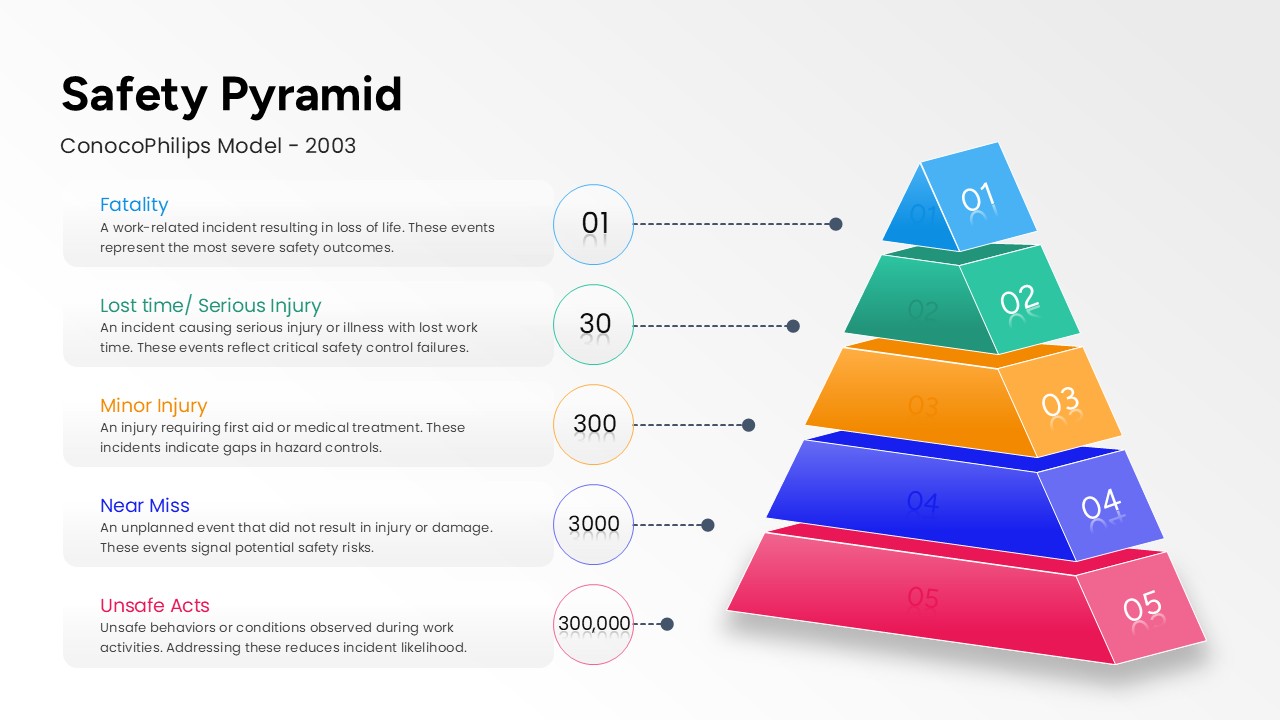
Multi-level incident pyramid diagram with 5 blue and red tiers representing fatality and lost time data.
Product Highlights
No. of Slides
Category
Compatable With
Rating
0/5
(0 reviews)
Item ID
Author
Tags