Download PowerPoint Chart Templates and Graphs for Data Presentation
Simplify your reporting with our charts and graphs templates. Whether you need standard Bar and Column charts for sales or Gantt charts for project tracking, we can all. Get professional results in PowerPoint and Google Slides without the stress .
Sort by
-
 $4.99
$4.99 -
 $4.99
$4.99 -
-
 $4.99
$4.99 -
 $4.99
$4.99 -
 $4.99
$4.99 -
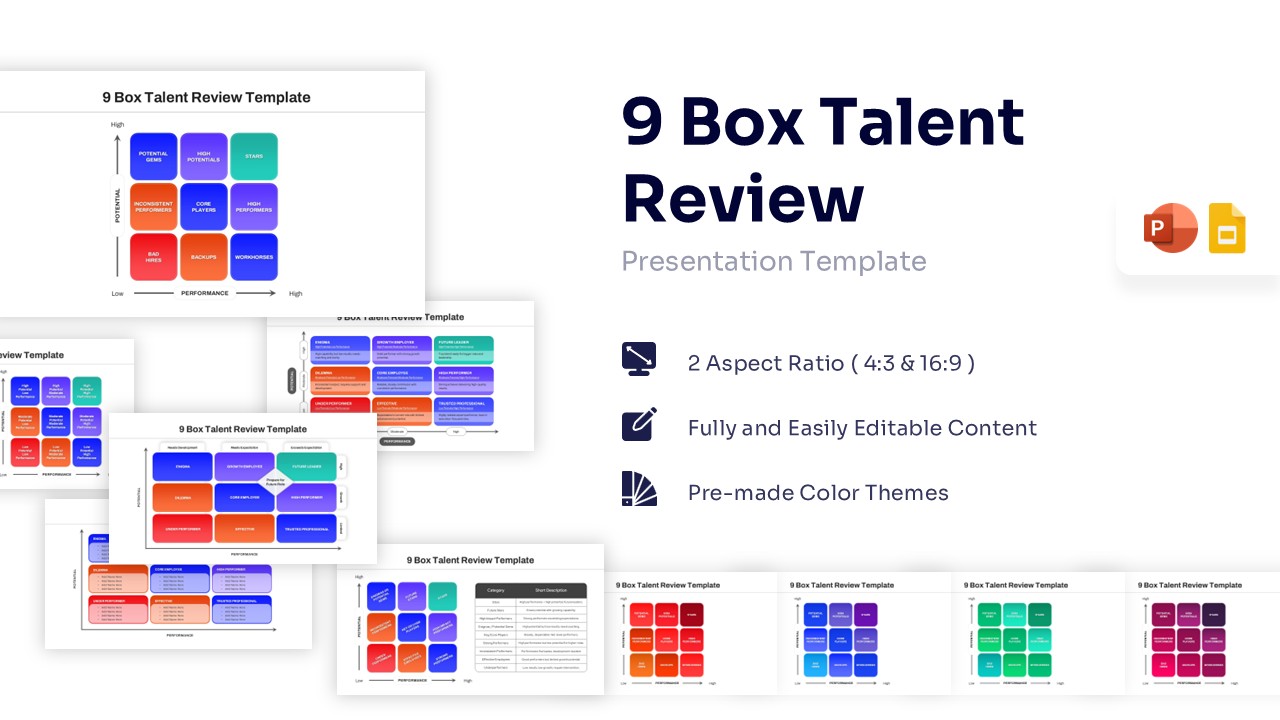
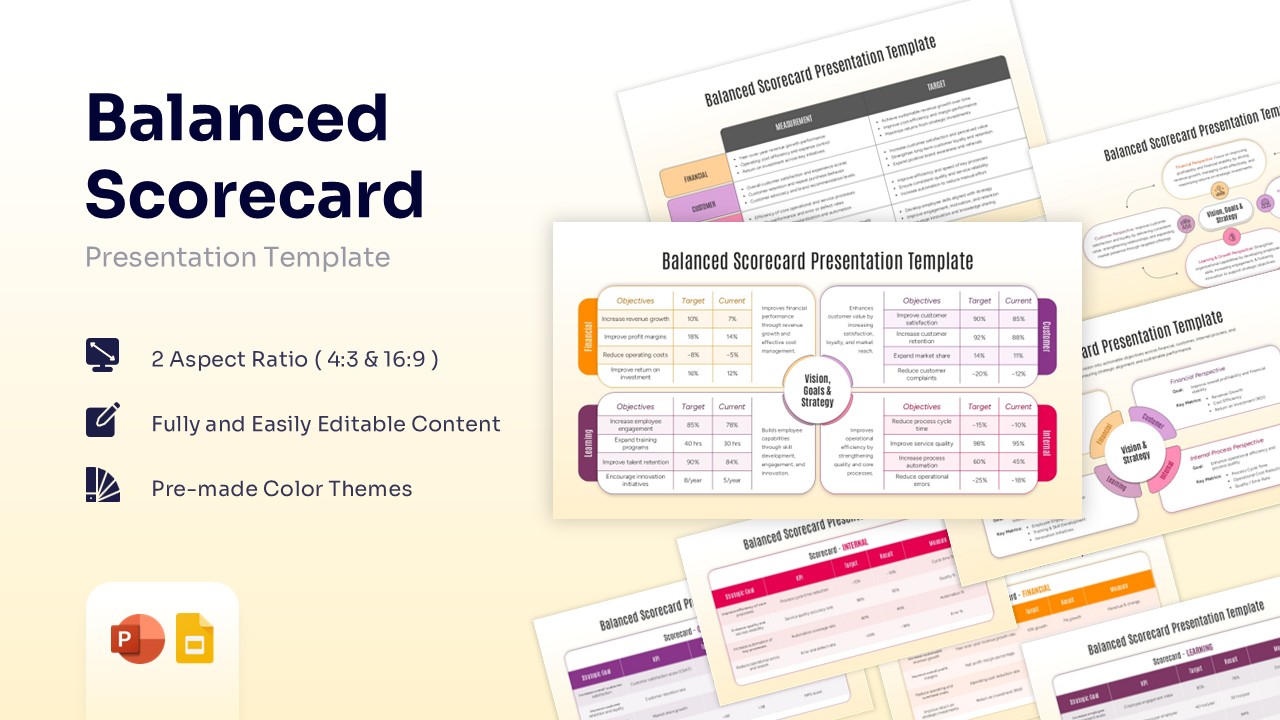
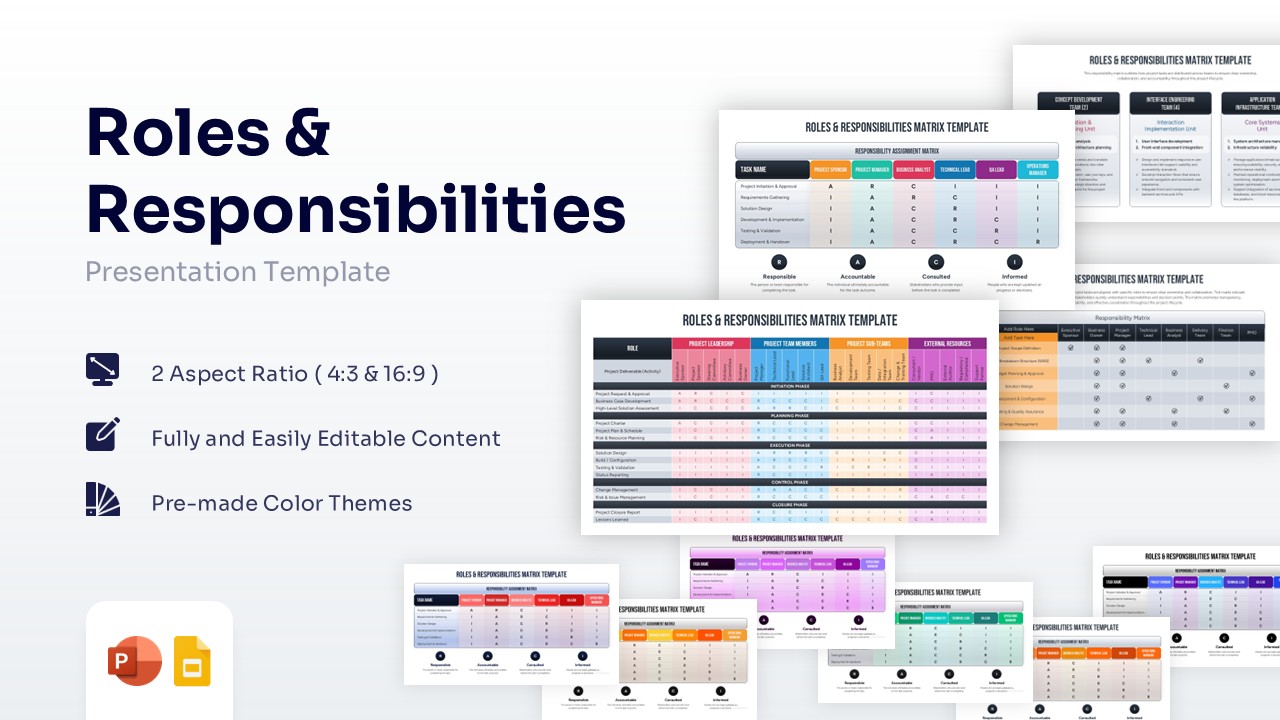
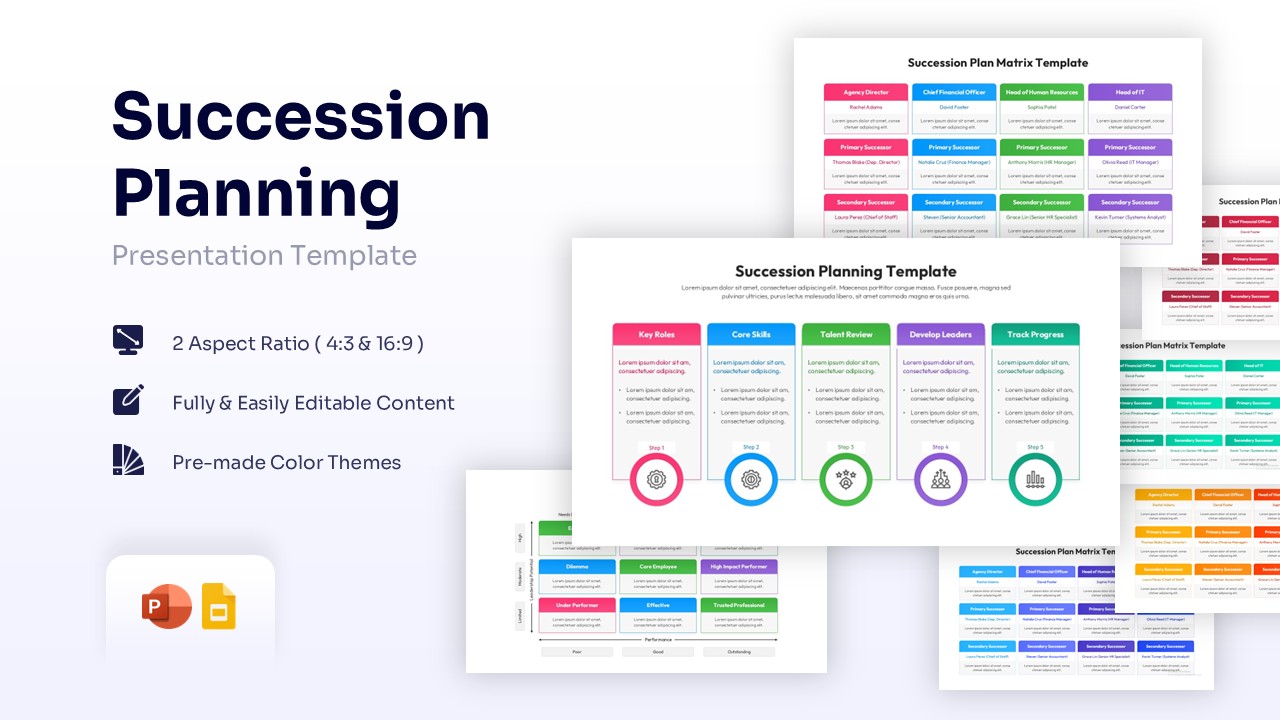
9 Box Talent Review PowerPoint Template & Google Slides
Charts & Graphs
$4.99 -
 $4.99
$4.99 -
-
 $3.99
$3.99 -
 $3.99
$3.99 -
-
-
 $3.99
$3.99 -
-
-
-
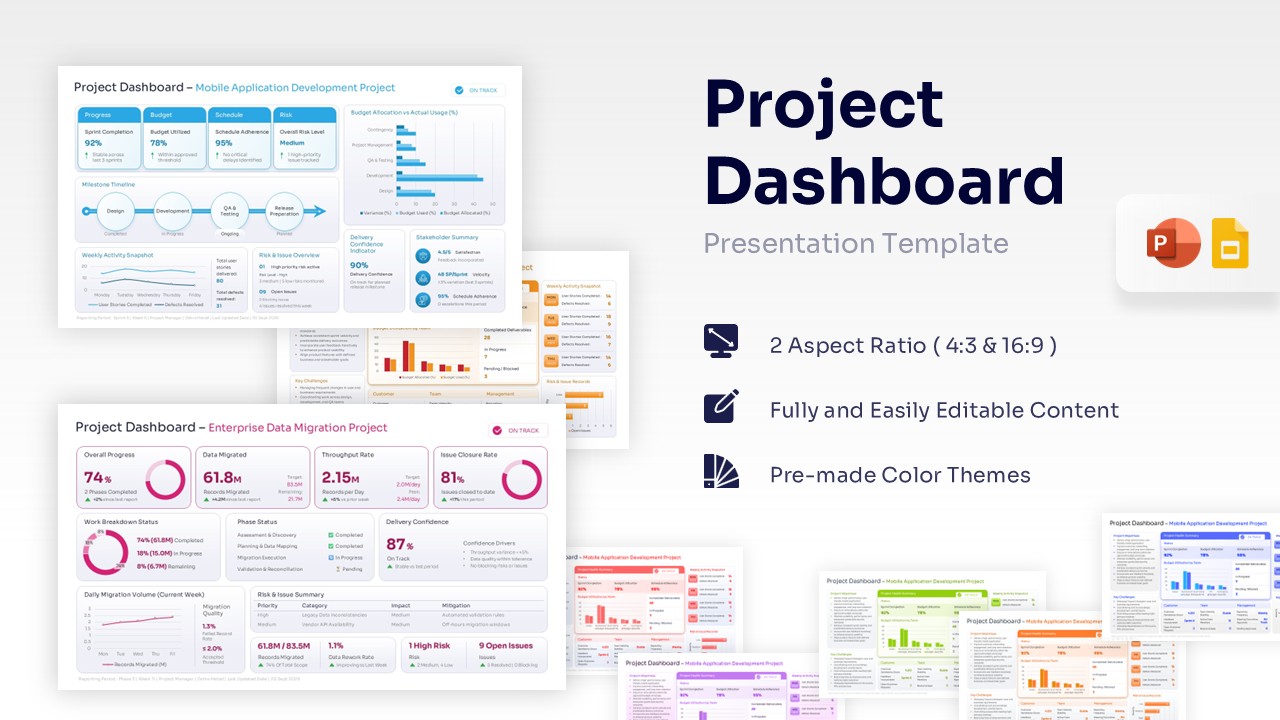
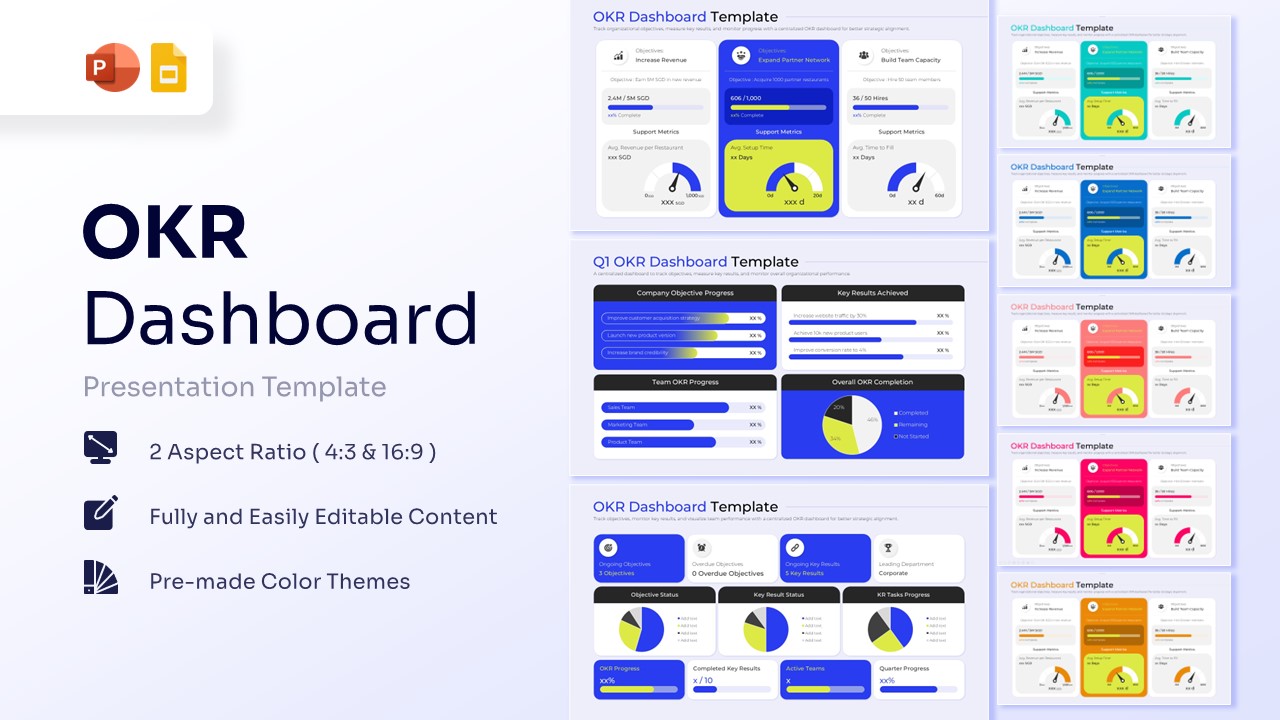
Project Dashboard Template for PowerPoint & Google Slides
Charts & Graphs
$3.99 -
 $3.99
$3.99 -
-
-
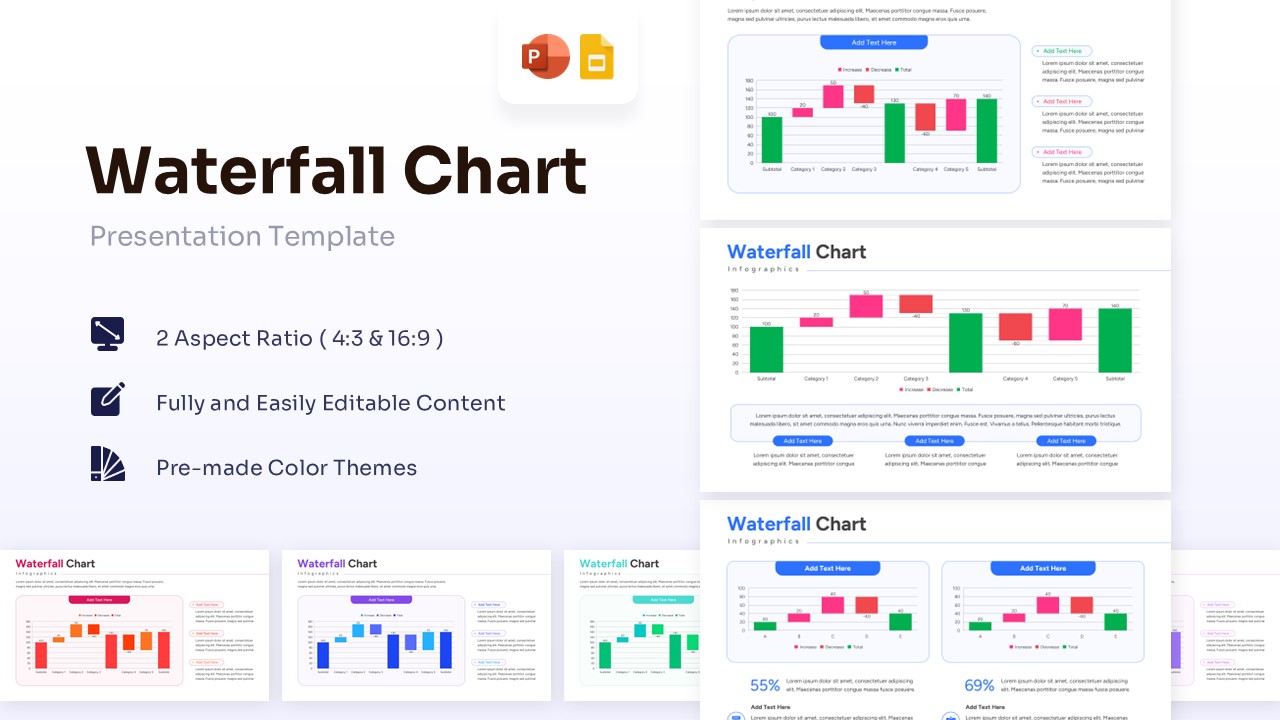
Waterfall Chart Template for PowerPoint & Google Slides
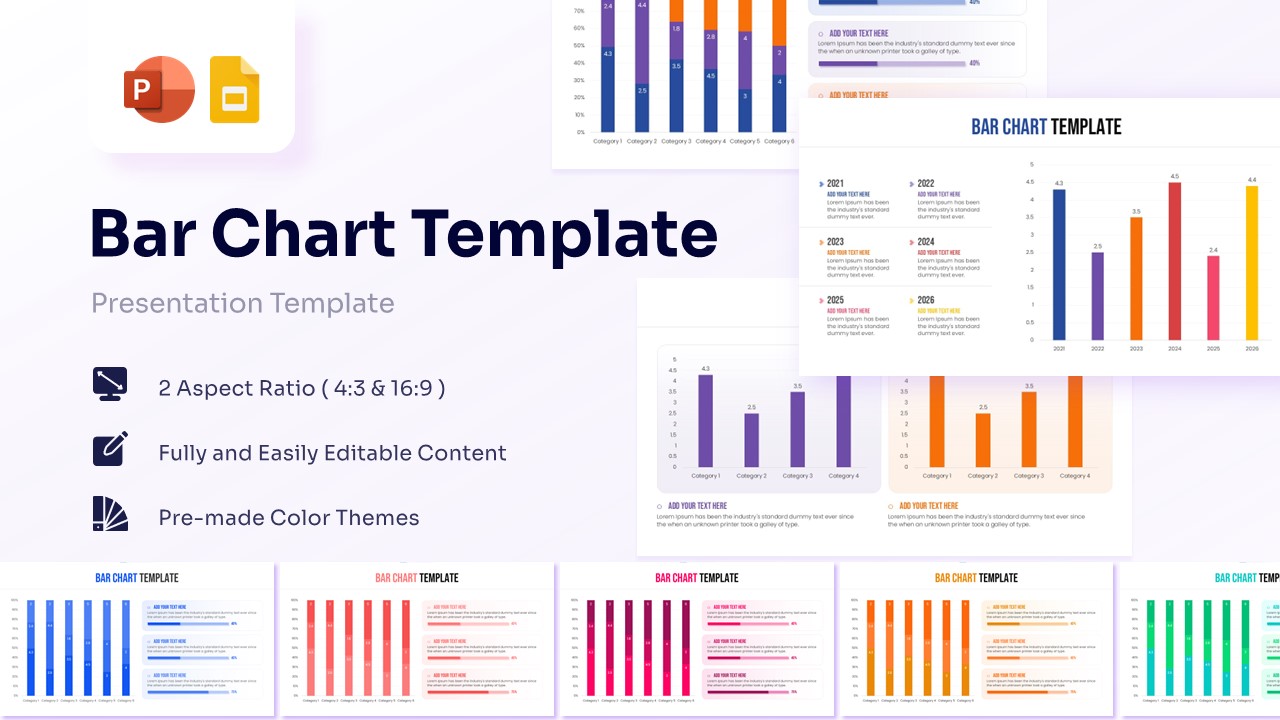
Bar and Column
$3.99 -
-
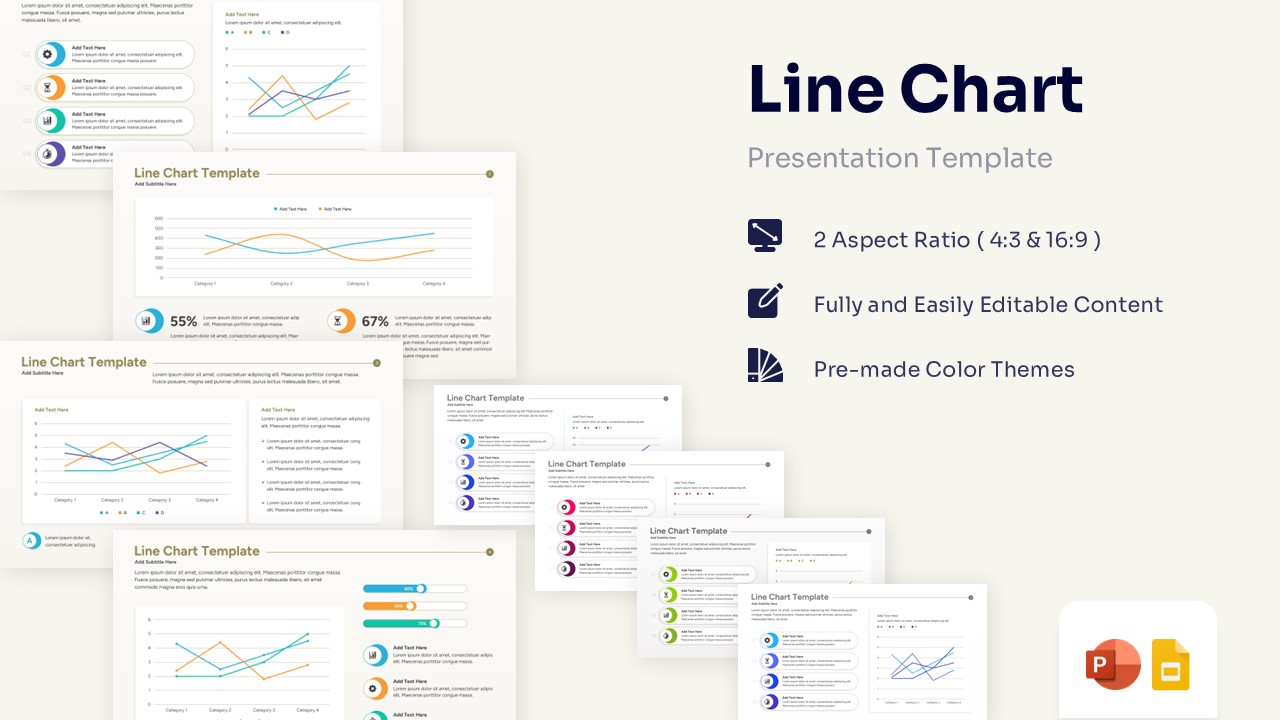
Professional Line Chart Template for PowerPoint & Google Slides
Charts & Graphs
$3.99 -
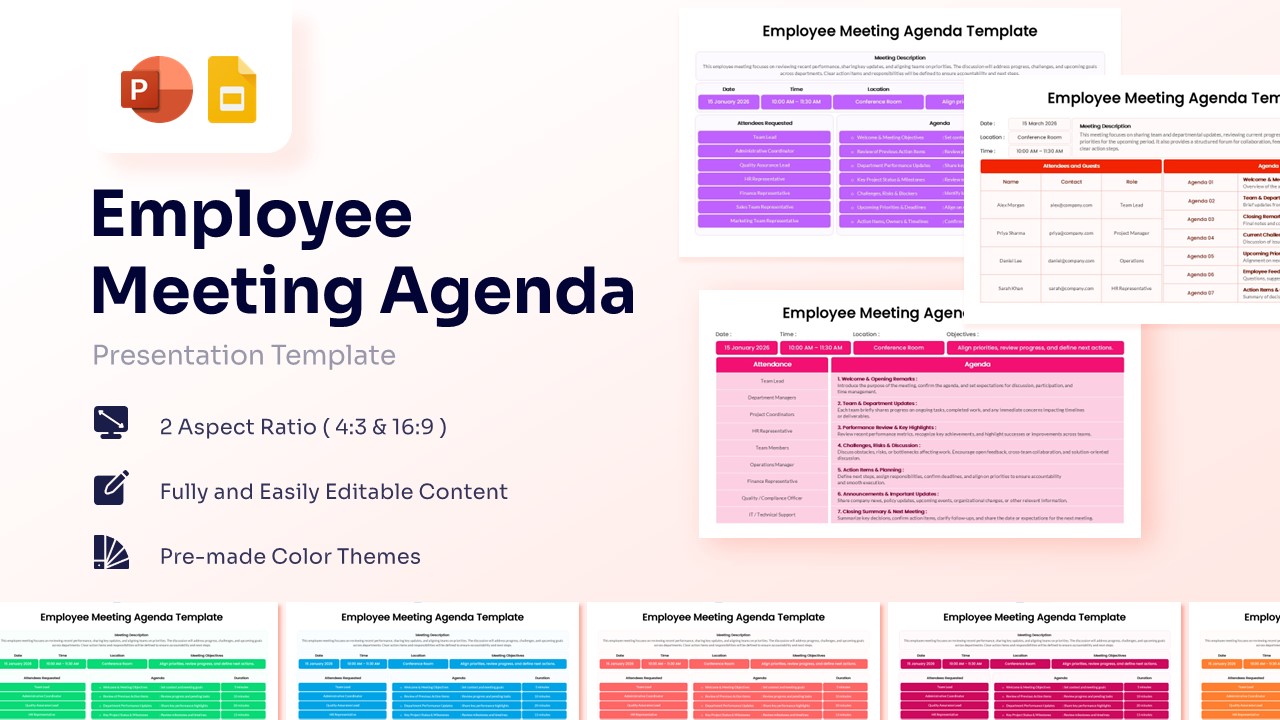
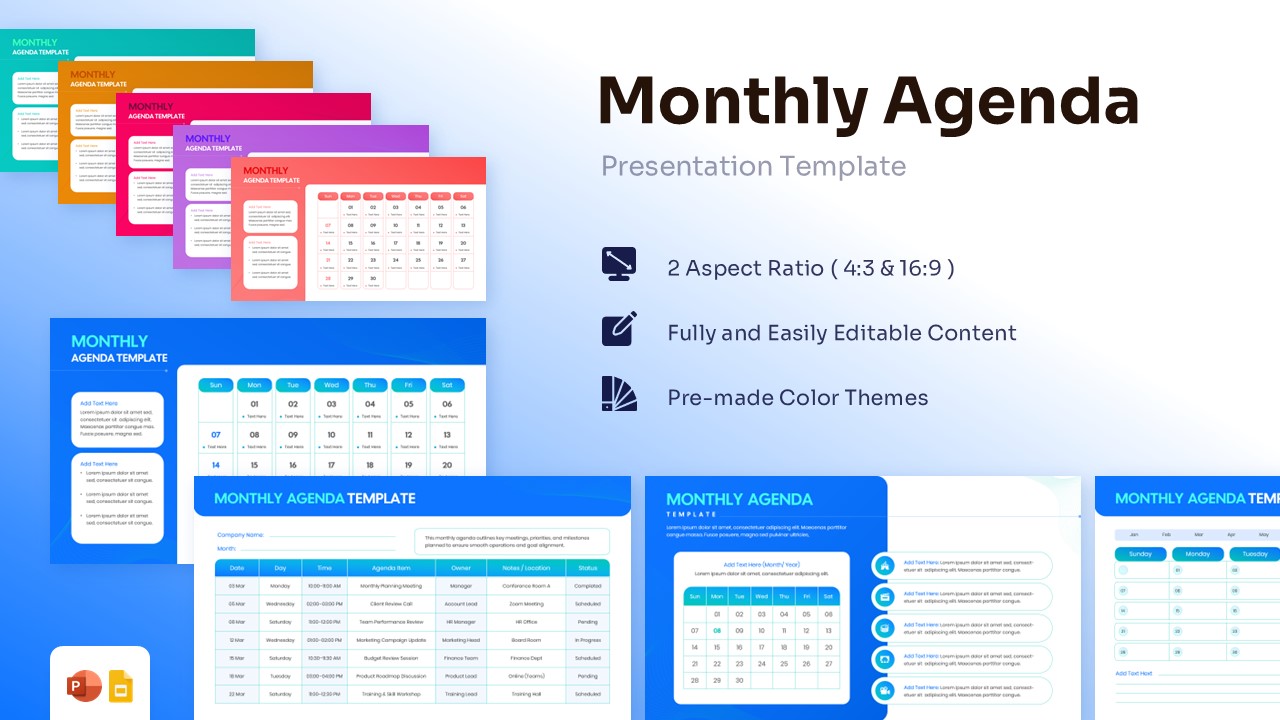
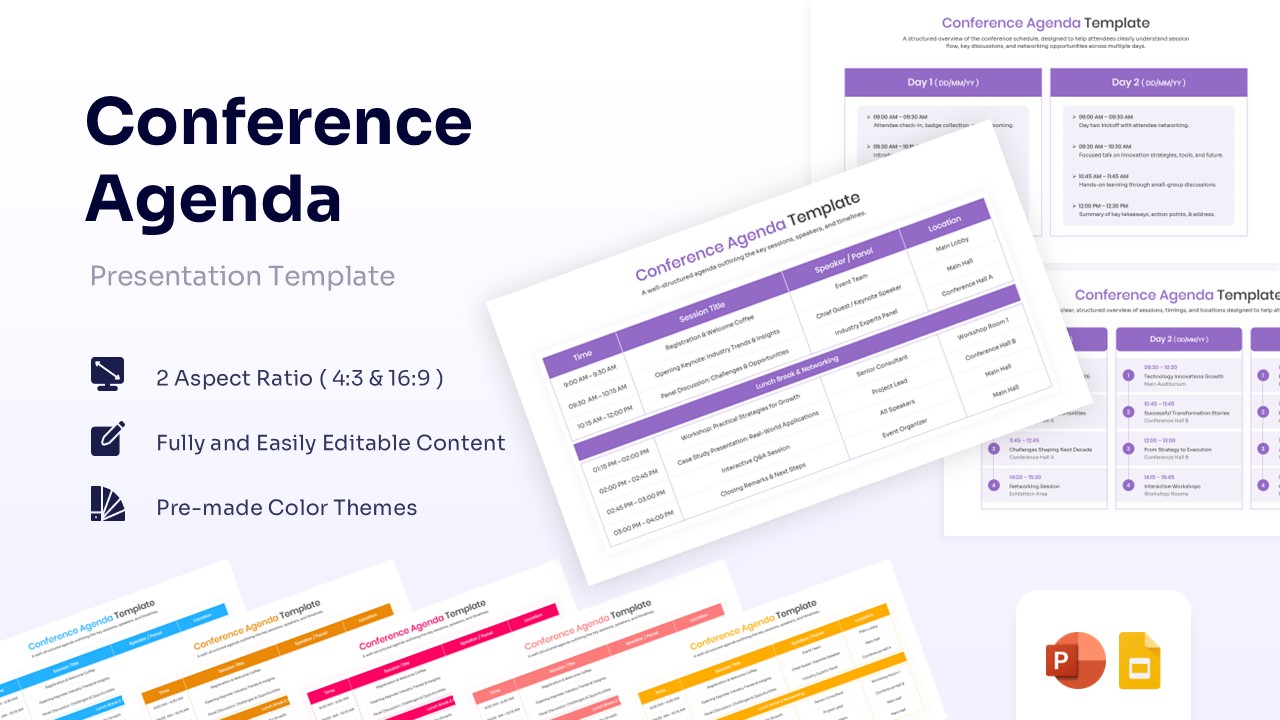
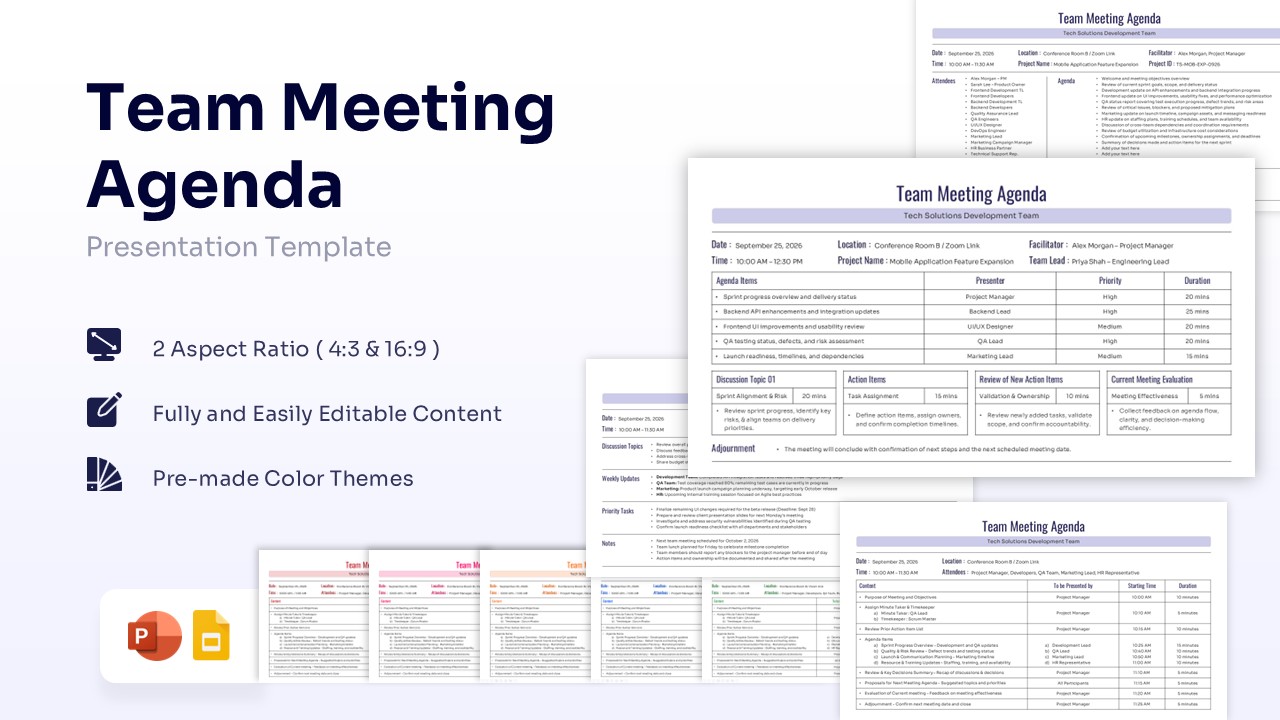
Employee Meeting Agenda Template for PowerPoint & Google Slides
Charts & Graphs
$3.99 -
 $3.99
$3.99 -
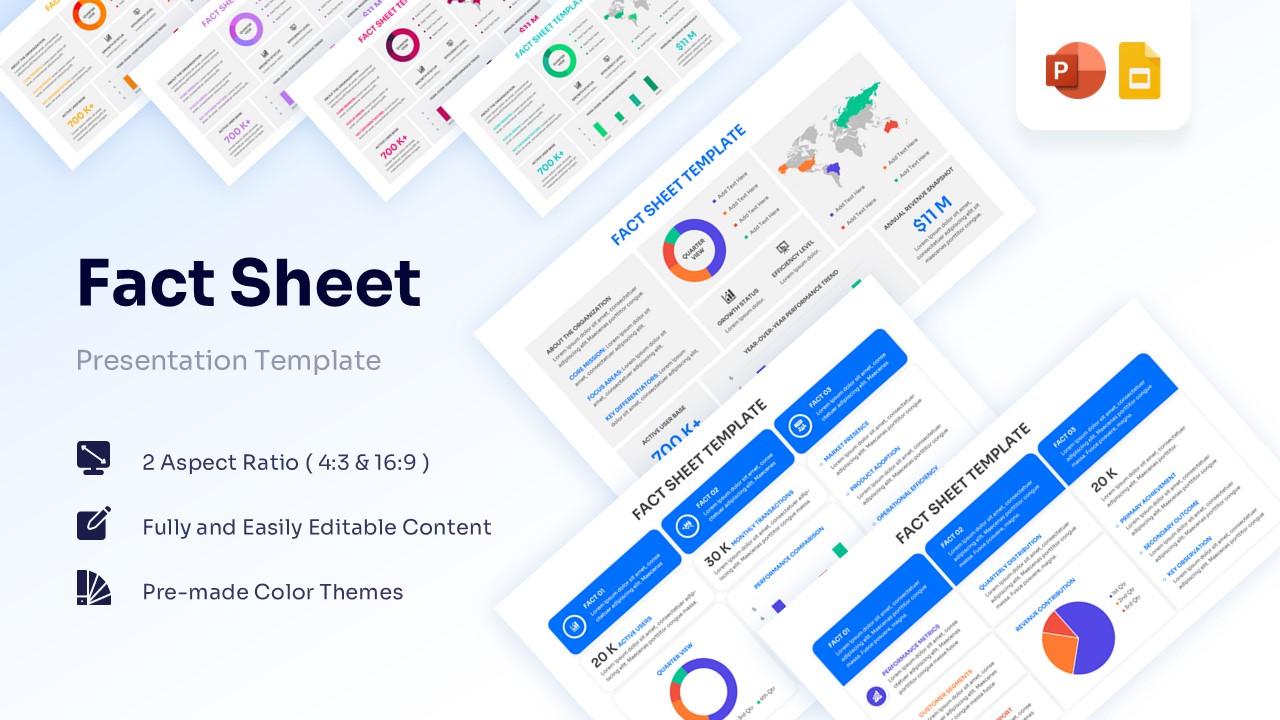
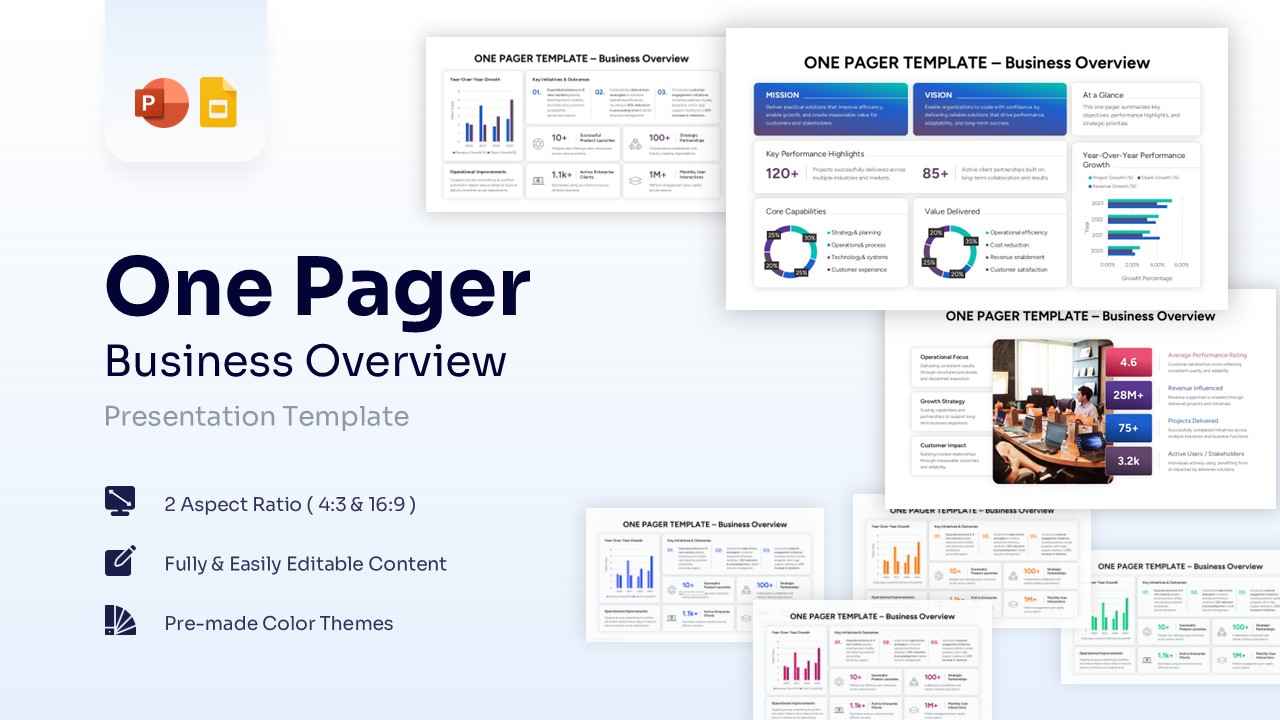
Corporate Fact Sheet Template for PowerPoint & Google Slides
Charts & Graphs
$3.99 -
 $3.99
$3.99 -
-
 $3.99
$3.99 -
-
-
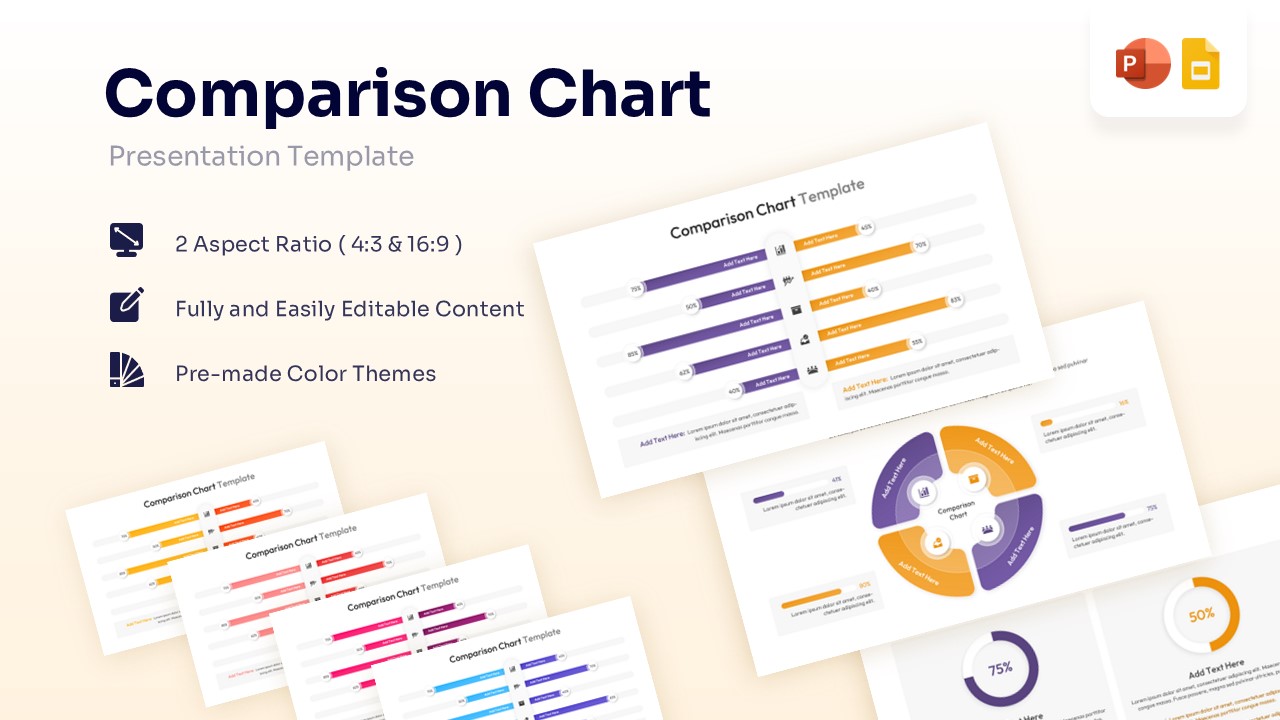
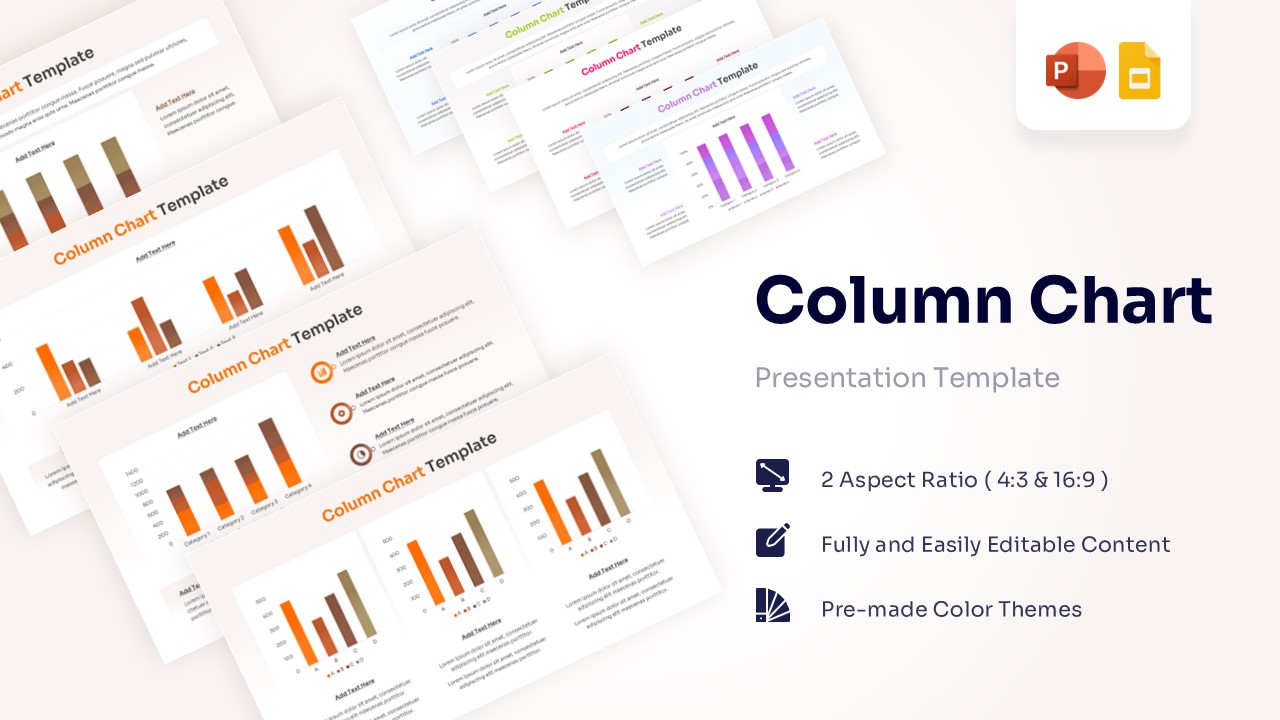
Comparison Chart Template for PowerPoint & Google Slides
Bar and Column
$3.99 -
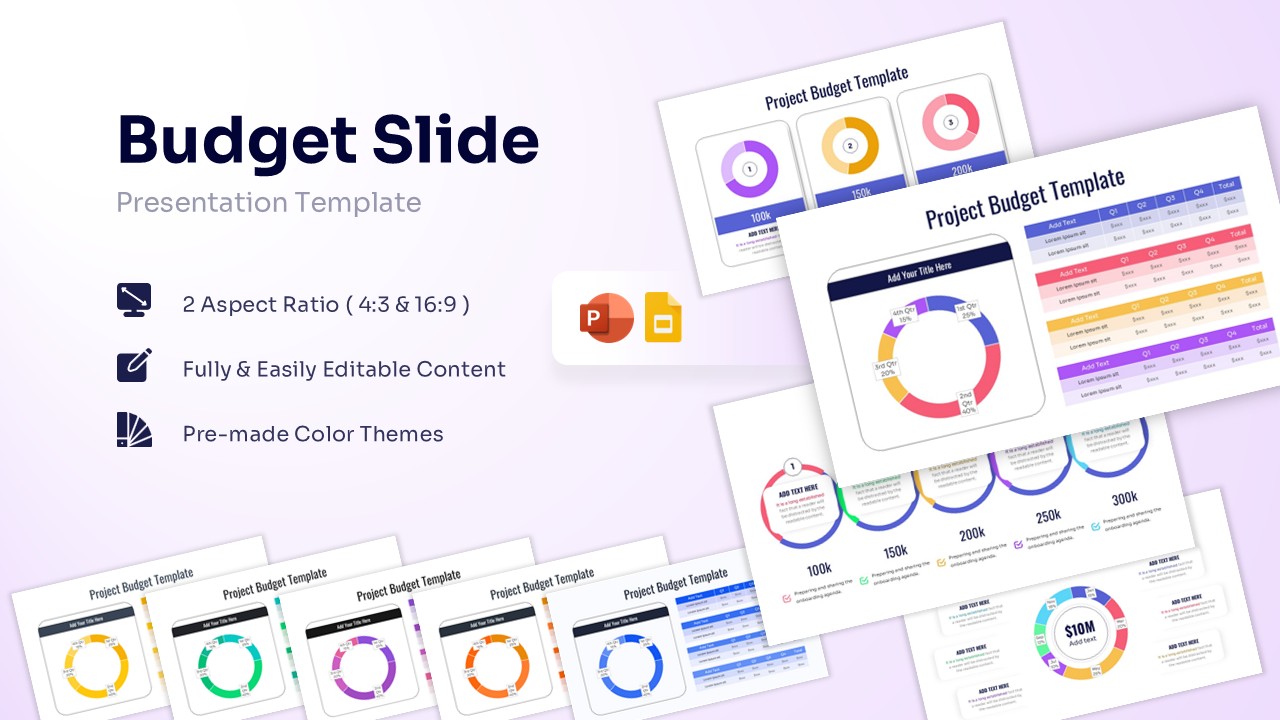
Project Budget Template for PowerPoint & Google Slides
Annual Report
$3.99 -
 $3.99
$3.99 -
 $3.99
$3.99 -
-
 $3.99
$3.99 -
-
-
-
-
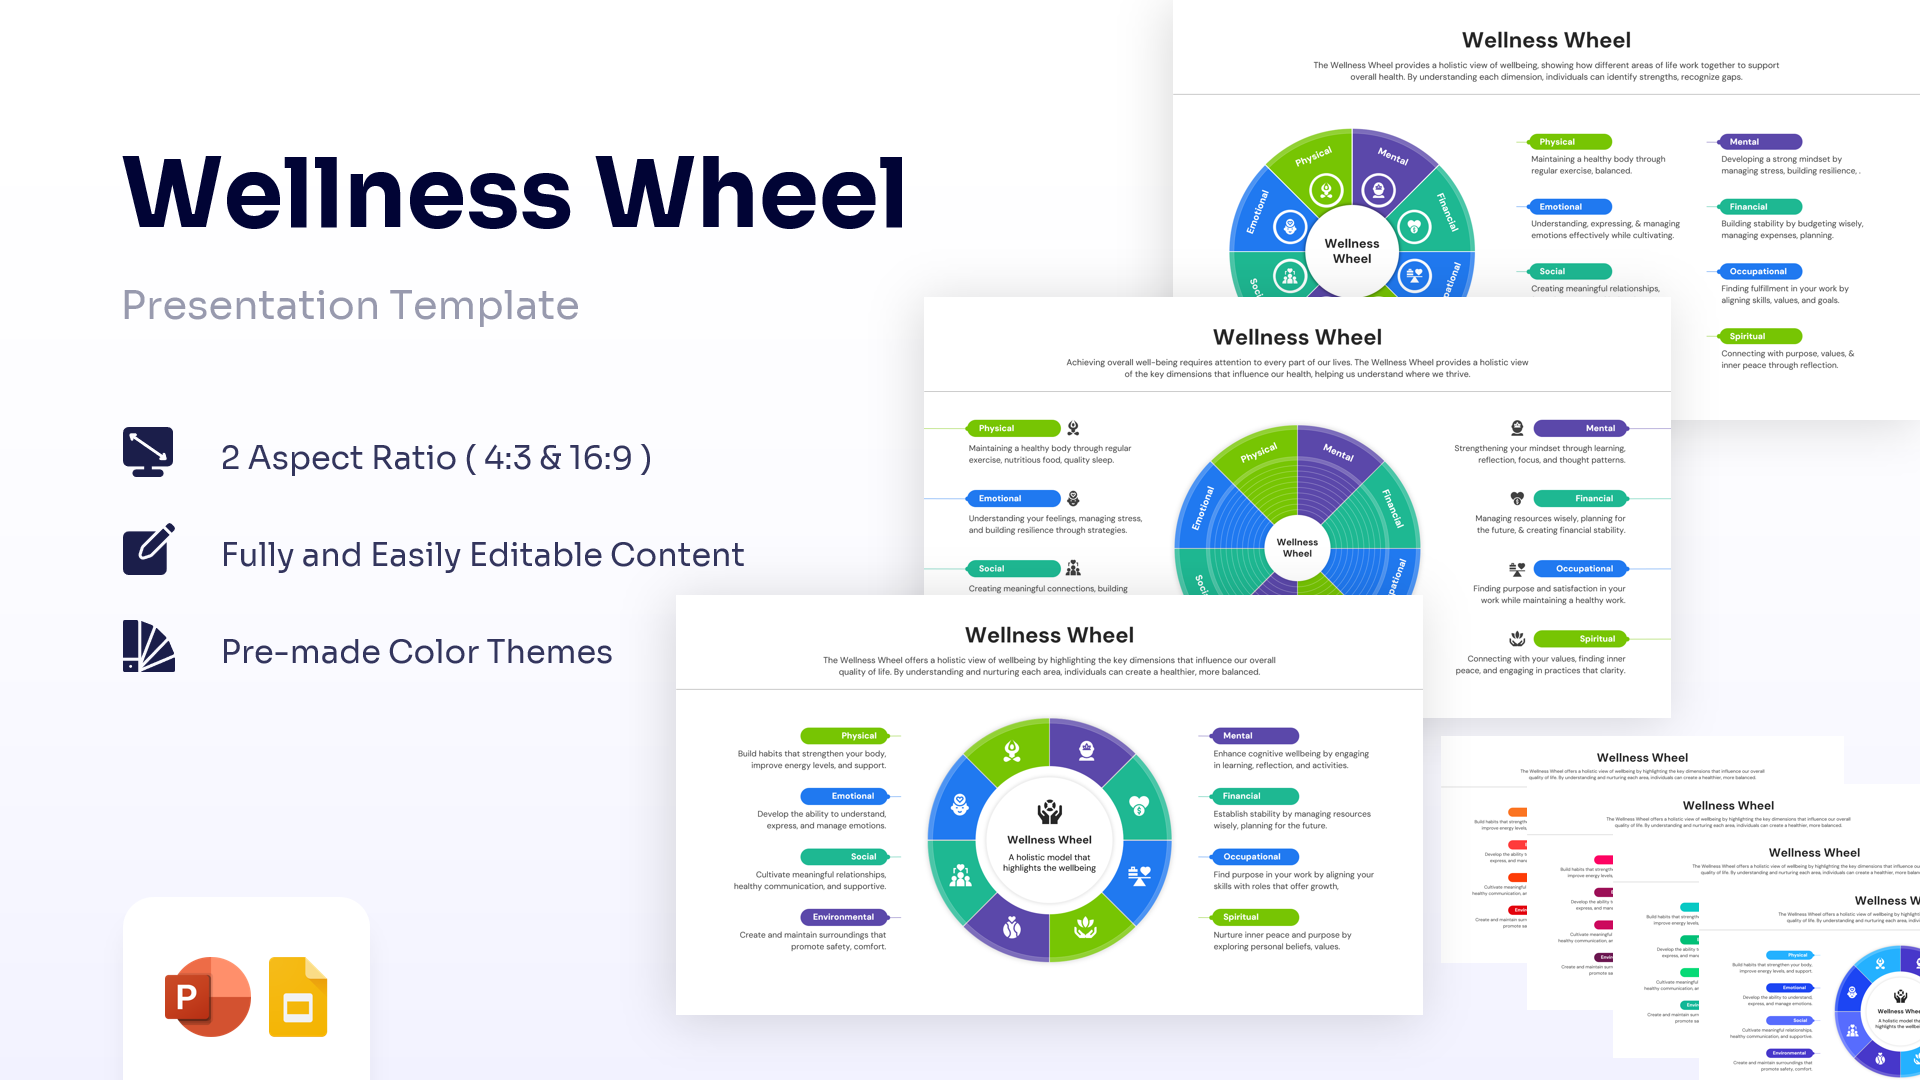
Wellness Wheel Template for PowerPoint & Google Slides
Charts & Graphs
$2.99 -
 $2.99
$2.99 -
 $2.99
$2.99 -
-
 $2.99
$2.99 -
-
-
-
 $2.99
$2.99 -
 $2.99
$2.99 -
Bubble Chart Template for PowerPoint & Google Slides
Charts & Graphs
Free -
-
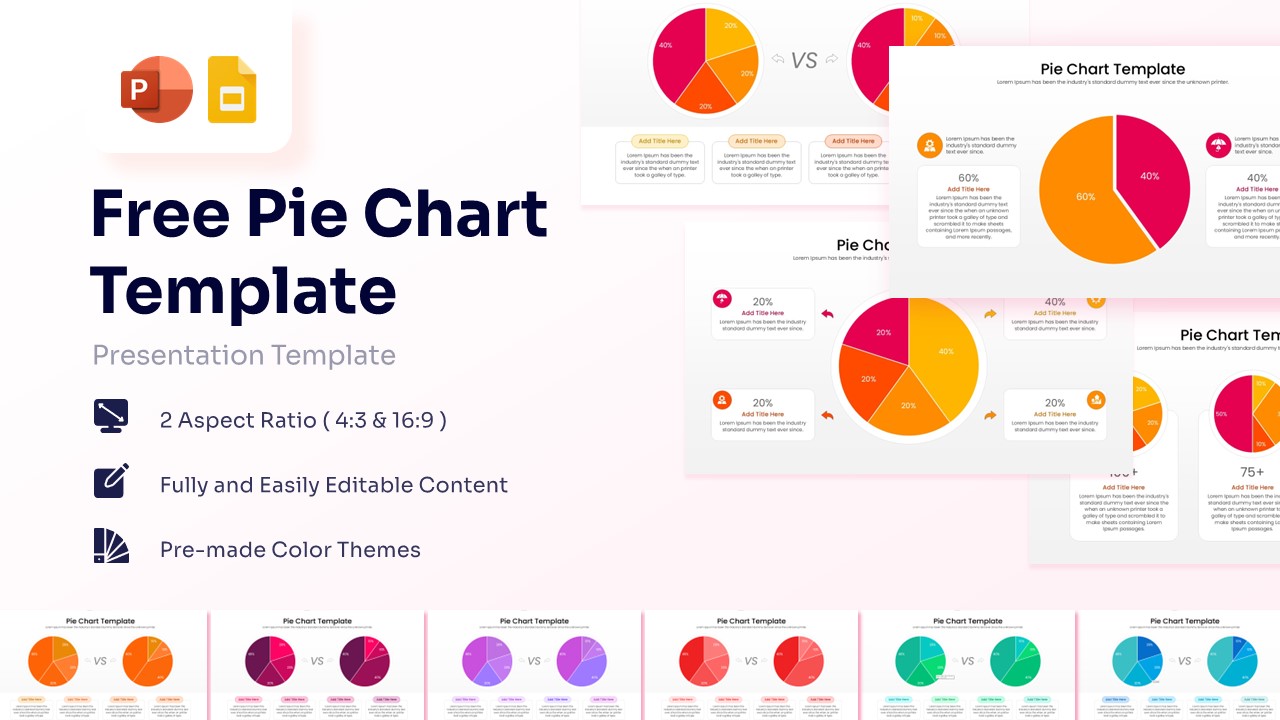
Free Pie Chart Template for PowerPoint & Google Slides
Charts & Graphs
Free -
 Free
Free -
 Free
Free -
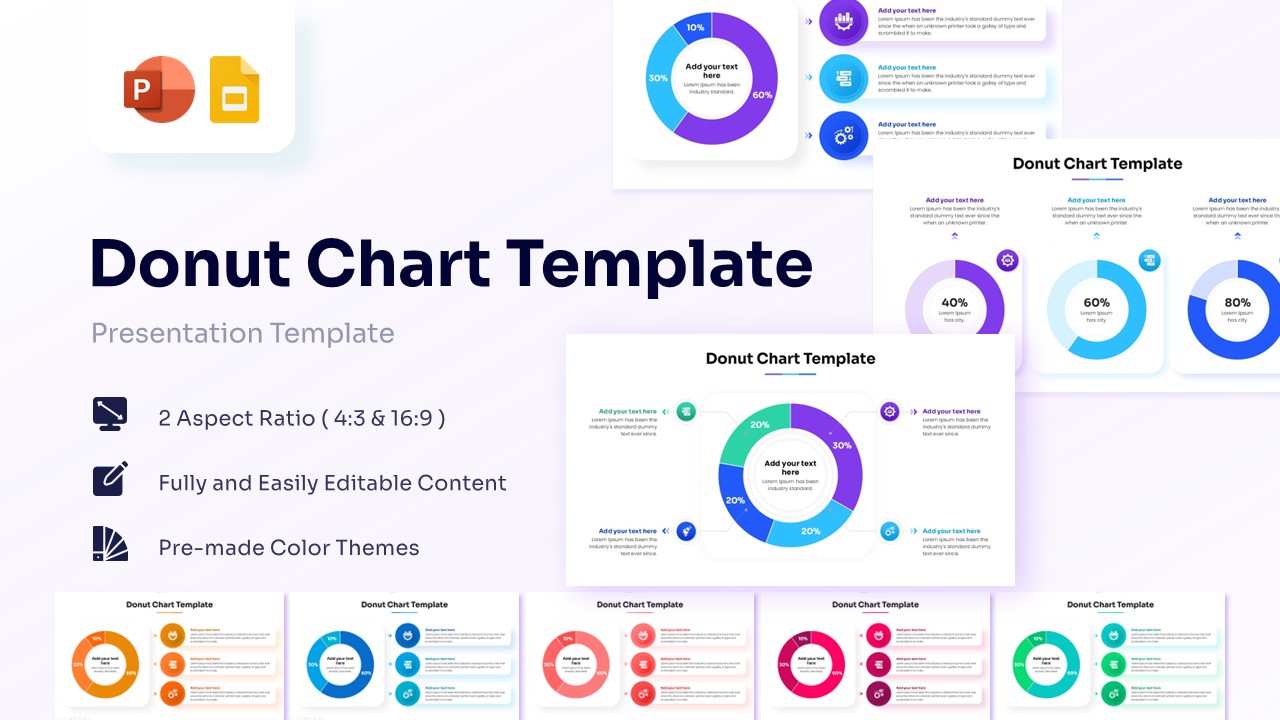
Free Donut Chart Template for PowerPoint & Google Slides
Charts & Graphs
Free -
 Free
Free -
-
Frequently Asked Questions
What is a chart template?
A chart template is a pre-designed layout that helps you visualize data using graphs like bars, lines, or pies without building the structure from scratch. It provides a professional framework where you can simply input your numbers to see them represented visually.
WinSlides offers a wide range of professional chart templates for PowerPoint and Google Slides that are fully data-driven. You can simply edit the numbers directly to update the visuals automatically, making your reports look expert-level in seconds.
Can ChatGPT generate charts?
Yes, ChatGPT can generate charts by analyzing your data and creating a static image or providing code (like Python or Mermaid.js) that you can render elsewhere. However, these are often basic, non-editable images that can be difficult to format for professional presentations.
The professional alternative: instead of struggling with static images or code, use WinSlides chart templates. Our designs are native to PowerPoint and Google Slides, meaning they are fully editable and data-driven. You don't need to write prompts; simply right-click to edit the data, and your beautiful, custom-branded chart is ready in seconds.
Are the charts data-driven (linked to Excel)?
Yes. Our chart templates are designed to be data-driven. This means they are linked to an embedded spreadsheet (Excel in PowerPoint or Sheets in Google Slides). You can simply right-click the chart, select "Edit Data," and input your own numbers. The visual graph will automatically update to match your values.
Can I buy a single chart template?
Yes. If you only need one specific graph for a report—for example, a specific pie chart or area graph—you can use our single purchase option. You do not need to buy a complete subscription or a full deck just to get the one visual you need.